What Is Performance Reporting: Essential 2026 Guide
Learn what is performance reporting and why it's crucial for nonprofits. Our guide explains KPIs, frameworks, and how to create reports that wow funders.

Abdifatah Ali
Co-Founder
You're probably reading this with a half-finished funder report open in another tab, a spreadsheet only one staff member can decode, and a quiet concern that your team's work is stronger than your reporting makes it look.
That gap is usually the underlying issue behind the question what is performance reporting. Nonprofits rarely struggle because they do not care about results. They struggle because reporting gets treated like an end-of-deadline task instead of a tool for running programs, making the case to funders, and deciding what to fix next.
I've seen this pattern in small and mid-sized organizations for years. Staff collect attendance, case notes, survey responses, and grant updates in different places, then try to stitch them together under pressure. The result is often a report that satisfies a requirement but does very little to help the team lead well.
Good performance reporting changes that.
It gives a nonprofit a practical way to show what it set out to do, what happened, what changed, and where leadership should pay attention now. In a nonprofit setting, that matters because reporting is not just about compliance. It is part storytelling, part management, and part proof that mission work is producing real progress.
For smaller organizations, the goal is not perfect data. The goal is useful data. A clear, lightweight reporting approach helps teams make better decisions without building a measurement system they do not have the time or budget to maintain.
What Is Performance Reporting Really
Performance reporting is a structured way to track progress against goals using a small set of measurable indicators, with each metric tied to an objective, a target, and trend context so leaders can judge whether results are on track or drifting. That's the core discipline described in Spider Strategies' guide to KPI reports.
For nonprofits, that definition gets more useful when translated into everyday work. Performance reporting is the practice of answering four questions on a regular basis:
- What did we plan to do
- What actions did we take
- What changed because of it
- What do we need to adjust
That's why I don't treat reporting as a paperwork exercise. I treat it as the operating system for mission delivery.
From compliance burden to management tool
Many organizations first encounter reporting through grant requirements. A funder wants updates. A board wants a dashboard. A government contract requires periodic documentation. So the report gets built backwards from whatever form has to be submitted.
That's understandable, but it creates weak reporting habits. Teams start collecting data because someone asked for it, not because the information helps them run a better program. The result is noise. Too many fields. Too many metrics. Not enough insight.
Practical rule: If a metric won't help someone make a decision, it probably doesn't belong in your core report.
The better approach starts with mission and management. If your organization wants to improve reading outcomes, stabilize housing, expand meal access, or retain youth in a program, the report should help staff and leadership see whether those goals are moving in the right direction.
Good enough beats perfect
Small nonprofits often delay reporting improvements because they think they need better systems first. Better CRM. Better survey design. Better staff capacity. Better data hygiene.
You don't need perfect data to build a useful reporting habit. You need consistent definitions, a manageable cadence, and a handful of metrics that matter. That's enough to begin seeing patterns, spotting risk, and telling a more credible story.
A strong report doesn't try to include everything. It highlights what matters most and gives context for interpretation. Done well, it helps you move from data chaos to confident storytelling without pretending your systems are more mature than they are.
Why Reporting Is a Nonprofit Superpower
A board meeting starts in ten minutes. The executive director has three questions on her notepad. Which program needs attention first. What results can go into the next grant report. Are staff stretched because demand is rising, or because the process is breaking down.
Good reporting helps answer those questions before the room starts guessing.
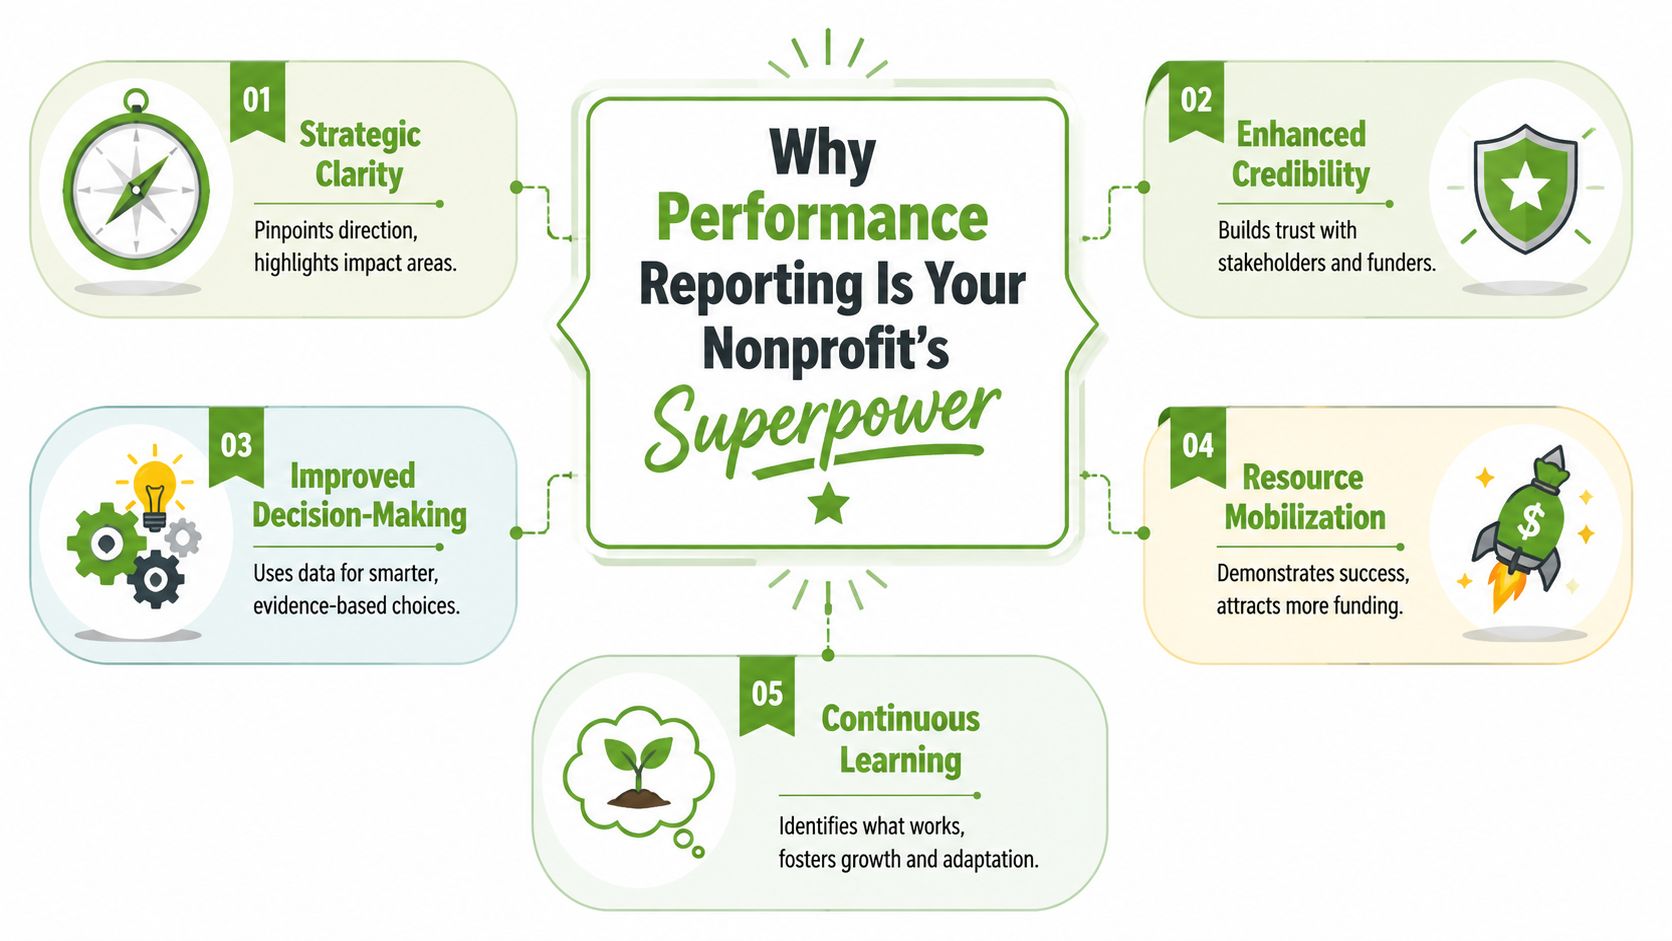
A nonprofit that reports well does more than show that funds were spent as intended. It shows that the organization can learn, adjust, and put limited time and money where they will do the most good. That changes how staff manage programs, how boards make decisions, and how funders judge capacity.
It turns instinct into usable evidence
Nonprofit leaders usually know a lot before they ever open a dashboard. They can feel when attendance is slipping, when staff are spending too much time on one step in the process, or when a referral partner is sending people who are not a good fit.
Reporting gives that judgment something to stand on. A short set of clear metrics tied to real goals helps teams confirm what they suspect, catch what they missed, and decide what to do next. That is a practical difference, especially in small organizations where every staffing or budget choice carries trade-offs.
For example, steady enrollment with falling completion rates points to a different problem than weak referrals with strong completion. Both can show up as stress in the program. Only one tells you to improve participant support. The other may tell you to revisit outreach, screening, or partner expectations.
It strengthens your funding story
Funders are not looking for a pile of disconnected numbers. They want a credible story about need, response, and results. They also want signs that your team pays attention and makes adjustments when the work is not landing as planned.
That is why performance reporting matters far beyond compliance. A useful report gives development staff language they can trust. It gives program staff examples they can explain. It gives leadership a clearer case for what deserves continued investment.
Good reporting supports the next ask because it shows how your organization learns, not just what it delivered.
This matters even more for small nonprofits. You may not have perfect outcome data or a polished evaluation team. You can still present a strong case with consistent definitions, a few meaningful measures, and honest context about what the numbers do and do not show.
It creates internal momentum
The best reporting systems improve morale because they help people see progress. Frontline staff can connect daily work to real change. Program managers can coach with specifics instead of general impressions. Board members can focus on oversight instead of getting lost in operational detail.
Reporting often becomes a genuine superpower in these areas:
- For executive directors: It clarifies priorities and makes trade-offs easier to explain.
- For development teams: It provides credible evidence for proposals, renewals, and donor updates.
- For program staff: It separates activity from progress and highlights where support is needed.
- For boards: It improves governance by focusing discussion on results, risk, and resource allocation.
I have seen small nonprofits get more value from a simple monthly report than larger organizations get from complicated dashboards. The difference is not sophistication. It is consistent use. When reporting becomes part of how the organization learns, it stops feeling like paperwork and starts helping the mission move faster.
The Anatomy of a Powerful Performance Report
A strong performance report does one job well. It helps a reader understand what your nonprofit did, what changed, and what needs attention next.
That sounds simple, but this is the point where many reports lose the plot. They pile in numbers, skip context, or blur activity and results until the story becomes hard to trust.
Outputs and outcomes are not the same thing
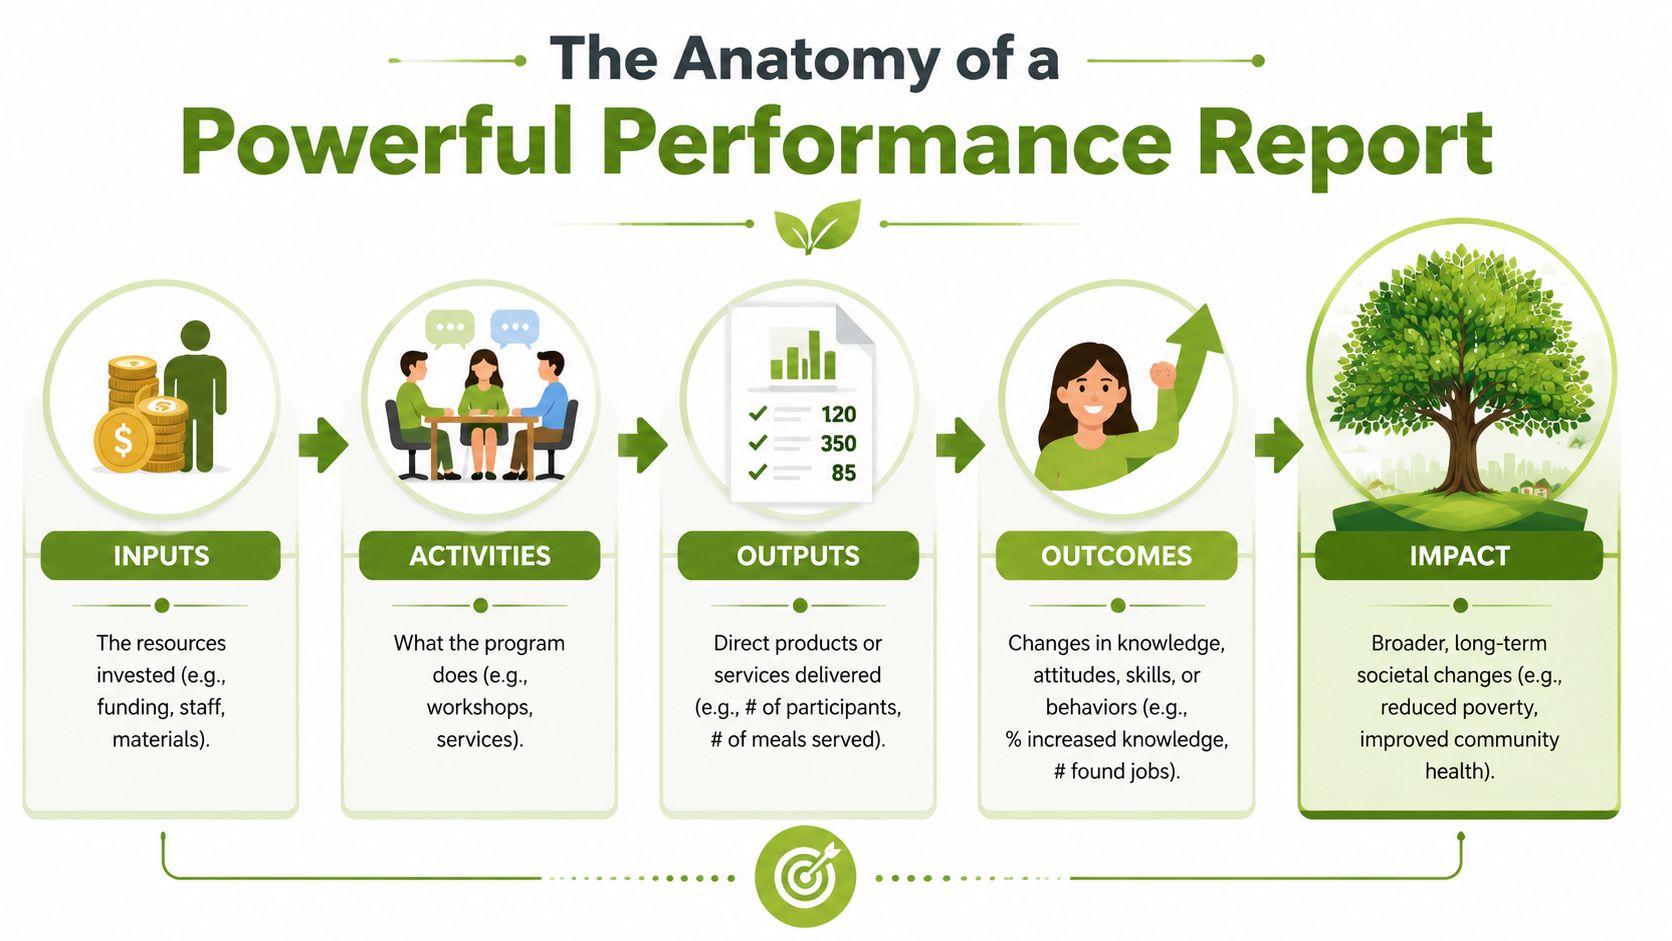
A useful report follows a clear chain. Inputs support activities. Activities produce outputs. Outputs contribute to outcomes. Over time, outcomes may contribute to broader impact.
Small nonprofits often get stuck because they try to jump straight to impact. Funders may ask for big-picture change, but your report still needs to show the middle steps. If you cannot yet prove long-term community change, you can still report credible progress. That is often enough to support decisions, renewals, and planning.
Outputs are the direct products of your work. They describe what the organization delivered. Workshops held. Families served. Hotline calls answered. Case plans completed.
Outcomes describe what changed for participants because of that work. Knowledge increased. Attendance improved. Stress levels dropped. Employment readiness strengthened.
| Reporting element | What it tells you | Simple nonprofit example |
|---|---|---|
| Output | What you delivered | Number of mentoring sessions completed |
| Outcome | What changed for participants | Participants report stronger school engagement |
| Impact | Broader long-term effect | Community sees stronger youth stability over time |
The distinction matters because each level answers a different management question. Outputs show whether delivery happened. Outcomes show whether the work is helping. Impact asks whether those changes add up over time in the wider community.
KPI selection is an act of discipline
Good reports are usually tighter than teams expect. I have seen organizations improve reporting quality by cutting metrics in half and defining the remaining ones properly.
Choose indicators that earn their place:
- Does this metric connect to a real objective
- Does it have a target, threshold, or expected direction
- Will someone act differently if the number changes
If the answer is no, the metric is probably decorative.
A board report might need only a handful of signals. A program manager may need a few more to coach staff and spot issues early. The trade-off is real. Too few metrics hide problems. Too many bury the point. For most small nonprofits, a short set of well-defined measures beats a crowded dashboard every time.
Field note: A report should help a leader decide where to press, pause, or adjust.
Start with the data sources you already have
You do not need perfect systems to build a report people will use. You need consistent definitions and a practical way to pull the same information on a regular schedule.
Most nonprofits can build a solid first version from existing tools:
- Spreadsheets: Useful for monthly counts, targets, and trend tracking.
- Forms and surveys: Good for participant feedback and short outcome checks.
- CRM records: Helpful when you need continuity across services, donors, or cases.
- Attendance logs and case notes: Valuable once staff record information the same way.
Messy data does not automatically make reporting useless. It means you should narrow the scope. Start with the measures you can collect consistently, explain the limits clearly, and improve from there. That is how reporting becomes a strategic asset instead of a compliance chore.
If you are shaping results for annual communications as well as internal review, this guide to a nonprofit annual report format can help connect performance data to a clearer public narrative. And if leadership needs to tie program results to financial choices, the principles used to optimize SME cash flow offer a useful reminder that reporting should inform resource allocation, not sit unread in a folder.
Choosing Your Reporting Framework and Format
A reporting system gets easier when you separate two decisions that organizations often mash together. First, decide how you'll think about performance. Then decide how you'll present it.
The framework shapes the logic. The format shapes the delivery.
Two frameworks that keep reporting grounded
The logic model is still one of the most practical tools for nonprofits because it maps a path from resources to results. You start with what you invest, move through activities and outputs, and then identify the outcomes you expect to see. That sequence keeps teams from claiming more than the data can support.
The SMART approach helps tighten individual indicators. A metric should be specific, measurable, achievable, relevant, and time-bound. Even if you never write the acronym down, the discipline matters. Vague measures produce vague reports.
A simple test works well in practice:
- Logic model asks: Does this metric sit in the right part of the story?
- SMART asks: Is this metric clear enough to track consistently?
When those two checks are in place, reporting gets less argumentative internally. Staff stop debating what a metric “means” halfway through the quarter.
One set of data can serve different audiences
The same core data should be repackaged differently depending on who's reading it. That's where many teams waste time. They build separate systems instead of tailoring the same evidence for different purposes.
| Report type | Best use | What it should emphasize | What to avoid |
|---|---|---|---|
| Funder report | Grant compliance and renewal support | Deliverables, outcomes, narrative context, variances | Internal jargon and unexplained data gaps |
| Internal dashboard | Leadership and program management | Trends, exceptions, targets, operational risk | Long narratives and decorative metrics |
| Public impact report | Donor and community communication | Mission story, selected results, accessible visuals | Dense tables and compliance-heavy language |
If your team is juggling multiple deadlines and funder formats, using a system built for grant compliance tracking software can reduce the scramble. The key is to maintain one source of truth underneath all three report types.
Example nonprofit KPIs by program area
Here's what “good enough” KPI selection can look like across different kinds of programs.
| Program Area | Example Output KPI (Activity) | Example Outcome KPI (Impact) |
|---|---|---|
| Youth mentoring | Mentoring sessions completed | Participants show stronger school engagement |
| Food access | Households receiving food support | Households report improved food stability |
| Workforce development | Job-readiness workshops delivered | Participants secure employment or improve job readiness |
| Housing support | Case management plans completed | Participants maintain more stable housing |
| Behavioral health | Counseling sessions attended | Participants report improved coping or stability |
Notice what's missing. There's no attempt to capture every possible metric. There's enough to tell a coherent story, manage performance, and support responsible decisions.
That's the standard worth aiming for.
Building Your Reporting System From Scratch
Monday morning. A program manager needs numbers for a funder update by noon, the executive director wants a board snapshot by Friday, and half the information lives in old spreadsheets or staff inboxes. That situation is frustrating, but it is also common. A workable reporting system starts by reducing that scramble, one repeatable step at a time.
A practical build sequence
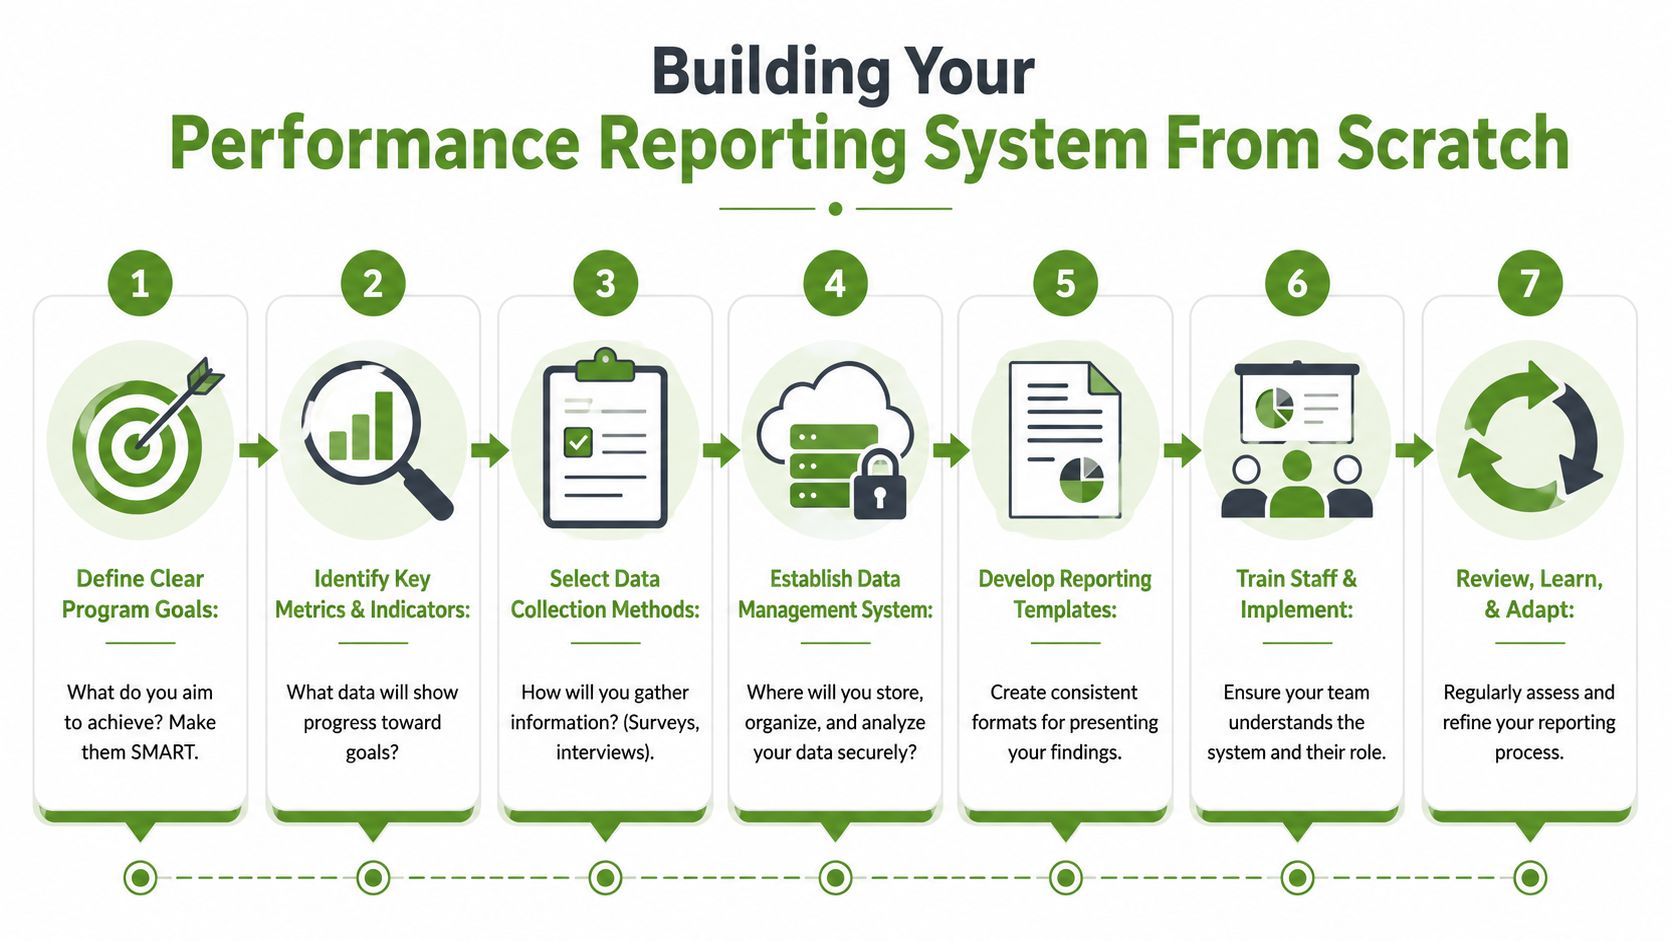
Start with the decisions your team needs to make, then build backward into the data. That keeps reporting tied to mission and management instead of turning into a paperwork exercise.
- Define success in plain language. Staff should be able to describe what changed for participants, not just recite grant language.
- Choose a small set of metrics that support action. If a number will not help staff adjust outreach, delivery, staffing, or follow-up, it probably does not belong in the first version of the system.
- Use collection methods your team can maintain. Intake forms, attendance logs, short check-ins, case notes, and a monthly spreadsheet review are often enough for a small nonprofit.
- Assign clear ownership. One person should be responsible for collecting each metric, checking quality, and flagging missing information.
- Create a review rhythm. Monthly internal review works well for many organizations. Funder deadlines should sit on top of that routine, not replace it.
I have seen plenty of nonprofits skip step four and pay for it later. Everyone assumes someone else is tracking the metric, then the gap shows up the week before a report is due.
Keep the system lean enough to survive
A reporting system has to hold up during staffing changes, busy program periods, and the end-of-quarter rush. Small nonprofits do better with a stable, good-enough process than an ambitious setup nobody can maintain.
Use this test before adding any new metric:
- Collection burden: Can staff gather it during normal work without pulling time away from participants?
- Clarity: Will different staff members record it the same way?
- Decision value: Will anyone use it to make a program or funding decision?
- Reporting fit: Can it support internal learning and external reporting?
That filter protects your team from overbuilding.
For larger data environments, teams sometimes review outside infrastructure options such as this Snowflake consulting services review to understand what mature reporting ecosystems can look like. Small nonprofits usually do not need that level of complexity. They need a reliable source of truth, shared definitions, and a process people will adhere to.
Tools should support the process
The right tool depends on volume, complexity, and staff capacity. A spreadsheet can work well if one program director owns it and reviews it consistently. A CRM makes more sense when you need participant histories across programs. A specialized platform helps when several grants require different deadlines, evidence, and reporting formats.
If your team is trying to manage multiple grant reporting requirements, build the workflow before you buy more software. Decide where data enters the system, who checks it, where documents live, and how reporting deadlines are tracked. Fundsprout can support that process with requirement tracking, deadline management, and report-ready program evidence, but the underlying foundation is operational discipline.
Good reporting systems are built to tell a clear story about mission progress. Start small, make the process repeatable, and improve it once the habit is in place.
Presenting Data to Funders and Your Board
A report only matters if people can absorb it and act on it.
That's where many nonprofit teams stumble. They collect the right information, then present it in a way that makes busy readers work too hard. A board packet gets packed with raw tables. A funder update lists activities but never explains why the numbers matter. The data is there, but the meaning is buried.
Match the presentation to the audience
Boards and funders don't need the same report, even when they care about the same program.
Funder-facing reporting usually needs a direct line from grant purpose to delivery and results. Show what was promised, what happened, and where context matters. If something slipped, explain the variance and the response.
Board reporting should stay at a higher altitude. Expert guidance recommends layered reporting, with summary views for executives and drill-down access for root-cause analysis, because that preserves quick interpretation while still supporting compliance, renewal tracking, and resource allocation, according to Indeed's overview of performance reporting.
That approach works well in nonprofit settings:
- For boards: Lead with a concise summary, major trends, and decisions needed.
- For program staff: Keep backup detail available for diagnosis and follow-up.
- For funders: Translate the same evidence into grant-specific language and expectations.
Give numbers a job to do
Numbers without context often create confusion.
If participation fell, say why. If outcomes improved, name what changed in delivery. If a target wasn't met, explain the operational constraint and the adjustment underway. Storytelling has its place here. Not as fluff, but as interpretation.
A strong presentation usually includes:
- A headline takeaway: What matters most in this reporting period.
- A trend or comparison: How current performance relates to the plan.
- A short explanation: Why the result looks the way it does.
- A clear implication: What the organization should do next.
Don't ask readers to infer the meaning of your data. State it.
Common mistakes that weaken a good report
A few mistakes show up repeatedly:
- Too much detail too early: Dense tables belong in appendices or drill-down views.
- No variance discussion: If actual performance differs from plan, address it directly.
- Overclaiming impact: Stay honest about what your data can support.
- No link to mission or resources: Results should connect to strategic choices and funding needs.
When nonprofits present data this way, reports stop feeling like an obligation. They become evidence of competence, learning, and momentum.
Fundsprout helps nonprofits turn grant requirements, program data, and reporting deadlines into a more manageable workflow. If your team is trying to reduce last-minute reporting scrambles while keeping proposals, compliance, and renewals aligned, Fundsprout is one option to explore.
Try 14 days free
Get started with Fundsprout so you can focus on what really matters.