Modern Nonprofit Annual Report Format Guide
Master the modern nonprofit annual report format. Learn to structure your report with compelling stories, clear visuals, and data to boost donor engagement.


Abdifatah Ali
Co-Founder
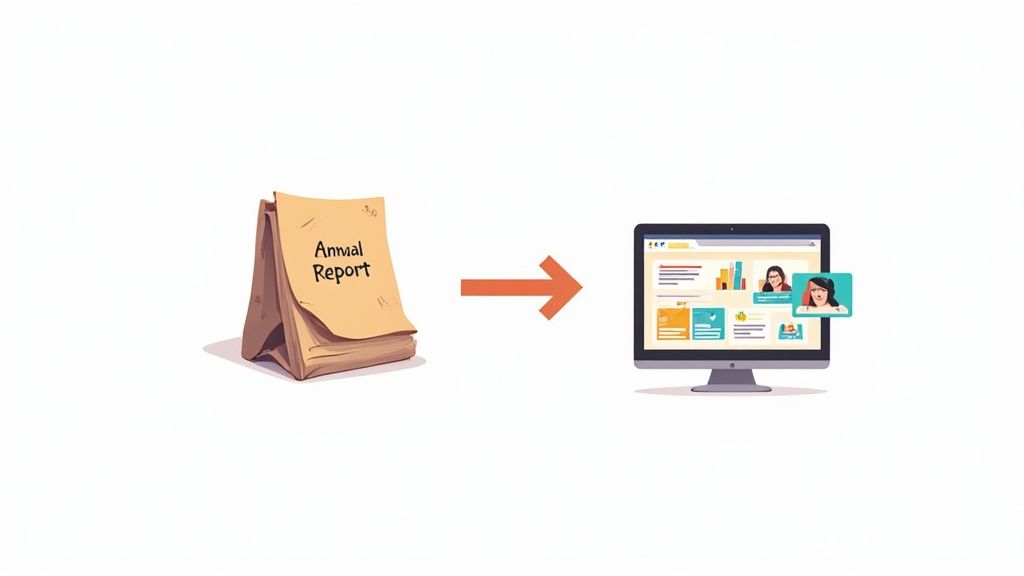
Let's be real—the days of dusty, text-heavy annual reports sitting unread on a shelf are long gone. The modern nonprofit annual report format is less of a dense booklet and more of a dynamic, digital-first experience. The focus has shifted dramatically toward telling a story, using powerful visuals, and presenting data in a way that proves your impact and connects with supporters on a human level.
Why Your Annual Report Format Needs A Rethink
If your annual report feels more like a compliance document than a celebration of your work, it’s time for a change. Today’s donors and partners expect to see transparency and impact, but they want it delivered in a format they can actually absorb and get excited about.
This isn’t just about aesthetics; it’s a strategic response to how people consume information now. Attention spans are short. The demand for visually engaging, easily digestible content has never been higher. Choosing a modern format isn't merely a design preference—it's a critical tool for building trust and securing the funding you need to keep your mission alive.
From Compliance Document To Connection Tool
Think of your annual report as one of the most powerful marketing assets you'll create all year. It's your big chance to reinforce your mission, highlight your incredible wins, and inspire people to stick with you. But if all that good stuff is buried in a jargon-filled PDF with walls of text, it’s a massive missed opportunity.
The new approach is all about prioritizing connection. It’s about transforming your report from a dry summary into:
- A compelling story about the real people you've helped.
- A vibrant showcase of your biggest accomplishments.
- A crystal-clear look at how you responsibly manage donor funds.
This isn't just a fleeting trend. It’s a direct response to what donors are asking for. By 2025, it's projected that nearly 60% of nonprofits will be producing reports of 10 pages or less, leaning heavily on infographics and storytelling. Why? Because 85% of major donors and board members now say they prefer digital formats they can quickly access and share. You can learn more about how donor preferences are shaping annual reports and see the data for yourself.
The goal isn't just to report information anymore; it's to inspire action. A great annual report makes a supporter feel proud of their contribution and excited to be part of your journey.
Proving Your Value In A Crowded Space
Nonprofits aren't just competing for donations; you're competing for attention. A thoughtfully designed report that uses sharp infographics, powerful photos, and personal stories will cut through the noise. It helps your audience instantly grasp the scale of your impact and see exactly where their money is going.
When you present financial data in a clear, visual way—like a simple pie chart showing program expenses versus overhead—you build trust almost instantly. This kind of transparency is what keeps your current supporters engaged and convinces new ones that you’re an effective, well-managed organization worthy of their gift. It’s about showing, not just telling, your value.
The evolution from traditional to modern annual reports is a significant one. Seeing the differences side-by-side really clarifies why updating your approach is so important for connecting with today's audience.
Traditional vs Modern Annual Report Format
Ultimately, adopting a modern format is about meeting your audience where they are. It’s about respecting their time and giving them a reason to feel genuinely connected to your cause.
Finding the Central Theme for Your Report
Before you even think about design or charts, your annual report needs a soul. That soul is your central theme—the one big idea that ties everything together. It’s the narrative thread that connects every statistic, every success story, and every financial number into a single, compelling message.
Without a strong theme, your report is just a data dump. With one, it’s a story that people will actually remember.
Think of your theme as the lens your supporters will look through to understand your entire year. It provides context, sparks an emotional connection, and makes your achievements stick. It’s the title of your year's story.
Brainstorming Your Core Narrative
So, how do you find this theme? Start by looking back at the last 12 months. What was the single biggest thing that happened? Was there a persistent challenge your team crushed, or a particular community you went all-in on supporting? Don't just list what you did—dig into the why.
Get your team together and kick around these questions:
- If we had to sum up this year in one word, what would it be? (Think: Resilience, Growth, Connection, etc.)
- What was our most powerful success story, and what bigger truth does it tell about our work?
- Did an unexpected event—good or bad—completely change our path this year?
This isn't just a warm-up exercise; it’s where the magic happens. For example, a food bank that launched a new mobile pantry might land on a theme like, "Meeting People Where They Are." An animal shelter that broke adoption records could build their story around "Bringing Families Together."
The goal is to unearth an idea that feels completely authentic to your experience and, at the same time, inspires the people reading it.
A great theme does more than summarize your activities; it communicates your purpose. It answers the question, "What was the spirit of our work this year?" and makes your supporters feel it, too.
Turning a Concept Into a Compelling Story
Once you’ve got that core concept, it's time to give it a name. A great title and tagline will start to shape your entire nonprofit annual report format. Your theme will dictate the headline on the cover, the captions under photos, and the tone of your financial summary. It keeps everything focused on telling the same story.
Here are a few real-world examples of how a theme frames the content:
- Focus: Perfect for showing how a single donation or volunteer hour created waves of positive change throughout the community.
- Focus: Highlights forward-looking projects, youth programs, or any long-term investments you're making in the future.
- Focus: Puts the spotlight on the volunteers, partners, and collaborative efforts that drove your success.
Choosing the right theme is the first and most important step in proving your impact and encouraging more support. A well-told story connects with donors on a much deeper level, making them feel great about their decision to back your mission.
And remember, your annual report is a critical fundraising tool. For more on that, check out our guide on the different sources of funding for nonprofits to see how this report fits into your broader strategy.
Structuring Your Report for Maximum Impact
A great nonprofit annual report isn't just a collection of facts and figures; it's a story. The best ones guide the reader on a compelling journey, and the right structure is your roadmap. It creates a logical flow that makes sure your key messages and emotional high points land exactly as you intend. Think of it as the blueprint for your year's narrative, where each section builds momentum from the last.
Most truly effective reports follow a similar, time-tested path. You start with a personal welcome, ground the reader in your core purpose, show them real results, present the financials with total transparency, and close with an inspiring look ahead. This approach covers all the critical information while keeping your supporters hooked from cover to cover.
This visual gives you a simple way to think about weaving your central theme through every part of your report.
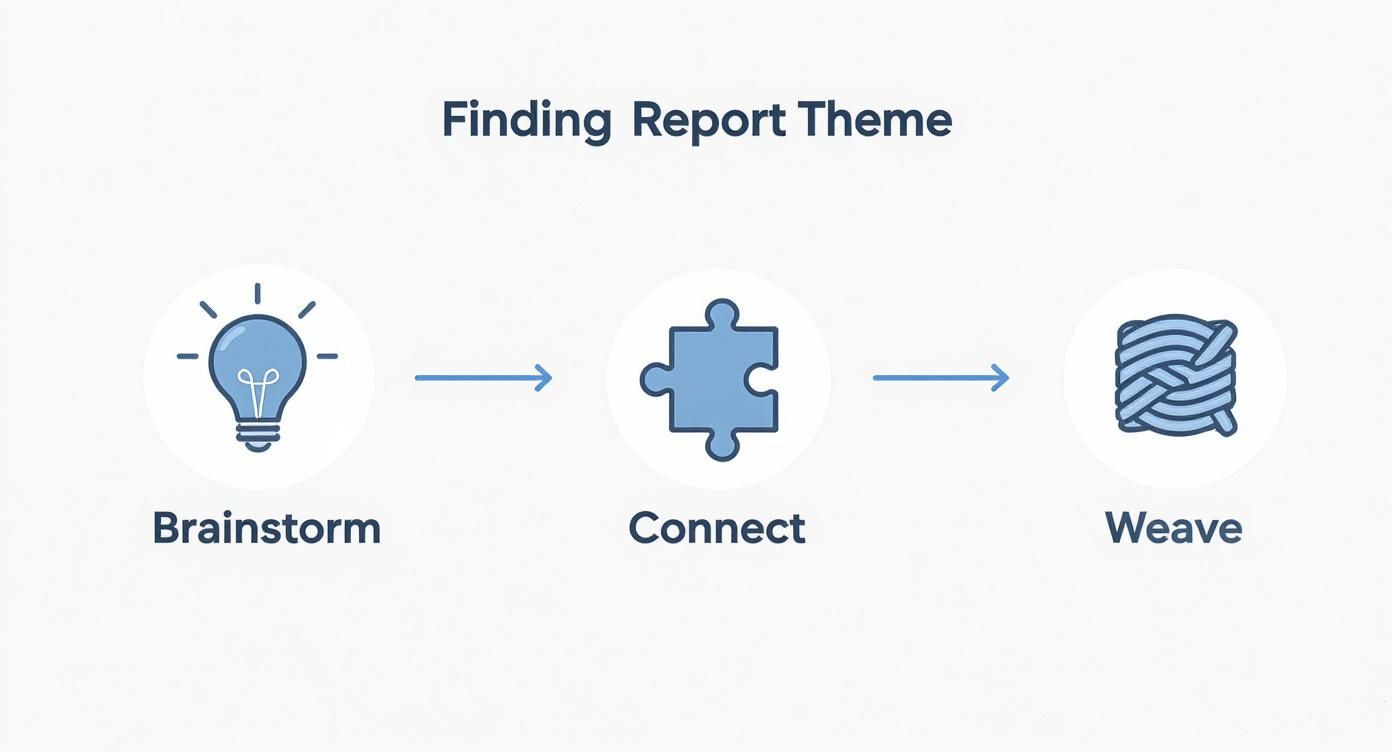
The key is to connect your big ideas directly to your mission before you start weaving them into a cohesive story throughout the entire document.
Opening With a Personal Touch
The Letter from Leadership is your first, best chance to set the tone. This is usually written by the Executive Director or Board Chair, and it's absolutely not the place for dry, corporate jargon. It needs to be a personal, authentic, and forward-looking message.
Get real about the year's biggest challenges and triumphs. More importantly, speak directly to your community of supporters with a "you-focused" voice. Instead of saying, "Our organization achieved X," try flipping the script: "Because of your support, we were able to achieve X." It’s a small change, but it makes your donors feel like the heroes of the story—which they are.
Stating Your Purpose and Vision
Right after that warm opening, you need to ground the reader in your "why." This is the perfect spot to re-introduce your Mission and Vision statements. But don't just copy and paste them from your website. Frame them with a short, inspiring paragraph that connects them back to the year's big theme.
This section is a crucial reminder for both new faces and long-time supporters of the fundamental purpose that drives every single thing you do. It reinforces the belief system behind the programs and stories they’re about to read, giving them essential context.
Showcasing Your Impact and Stories
This is the beating heart of your annual report. The Program Highlights and Impact Stories section is where you turn raw data into real human connection. You have to move beyond just listing metrics and tell the stories of the actual people whose lives have been changed by your work.
To really make this section sing, I recommend this approach:
- Feature 2-3 key programs: Instead of a laundry list, go deep on your most successful or meaningful initiatives from the year.
- Lead with a powerful story: Open with a personal testimonial or a short case study of someone you served. Let a real voice be the first thing your readers encounter.
- Visualize key metrics: Make your data pop. Use bold pull quotes, simple charts, or icons to represent achievements like "500 families fed" or an "87% program success rate."
An annual report is one of the most powerful tools in your fundraising arsenal. It’s not just a look back; it's a justification for future investment. By clearly articulating your impact, you’re making a compelling case for continued support.
Demonstrating Financial Transparency
Let's be honest—financials can be intimidating for a lot of people. But transparency is absolutely non-negotiable if you want to build and maintain trust. Your goal here is to make this section clear, simple, and easy for someone without an accounting degree to understand.
Often, a simple pie chart showing your Statement of Activities (where money came from vs. where it went) is far more effective than a dense spreadsheet. Break down expenses into clear, digestible categories: Program Services, Administrative, and Fundraising. This kind of visual instantly shows donors how effectively their contributions are being used to drive the mission forward.
The annual report serves a similar purpose to a well-structured fundraising plan by showcasing fiscal responsibility and strategic goals. For a deeper dive, you can learn how to build a comprehensive fundraising plan format in our dedicated guide.
Recognizing Supporters and Inspiring Action
Your report is a fantastic opportunity for stewardship. A dedicated Donor Recognition section is a simple but powerful way to make your supporters feel seen and appreciated. To respect privacy and save space, it's very common to list names by giving levels or tiers, without including the specific dollar amounts.
Finally, you have to end with a strong Call to Action (CTA). Your reader is now fully informed, inspired, and emotionally connected—don't just let that energy fizzle out! Make your CTA clear, specific, and forward-looking. Instead of a generic "Donate," tie it to your future goals. Try something like, "Help us reach 1,000 more students next year." This instantly transforms your report from a backward-looking document into a powerful catalyst for future growth.
Using Design to Tell a Better Story

Let's be honest: a great annual report is as much about how it looks as what it says. Strong design does more than just prettify your pages—it’s a powerful tool that makes your impact hit home in an instant. It can guide a reader’s eye through a year of hard work, clarify complex numbers, and forge an emotional connection that a block of text simply can't.
Think of your report's design as its body language. Every color, font, and photo you select sends a message, either reinforcing your story or muddying it. The real aim is to create a professional, cohesive experience that feels true to who you are and makes your mission tangible for everyone who reads it. This is a non-negotiable part of an effective nonprofit annual report format.
Creating a Clean and Professional Feel
First impressions matter, and the bedrock of good design is consistency and clarity. You’re aiming for a document that feels organized and is a breeze to read, which immediately builds trust and signals that you’re a professional organization.
Here’s where I always tell people to start:
- Stick to Your Branding: Pull your official colors, fonts, and logo into every single page. This isn’t just about looking good; it's about reinforcing your identity and creating a polished, unified feel from cover to cover.
- Use High-Quality Photos: Nothing screams "amateur" faster than grainy, poorly lit photos. It’s worth the effort to get crisp, high-quality images of your work in action and the people you serve. Authentic photos are always better than stock.
- Embrace Whitespace: Don’t be afraid to leave some empty space on the page! Whitespace is a designer's best friend. It gives your content room to breathe, keeps pages from feeling overwhelming, and draws the reader's eye right where you want it to go.
These three elements are the foundation. Get them right, and you'll have a report that feels both credible and inviting, encouraging supporters to lean in and learn more.
Your annual report's design should be an invisible guide, effortlessly leading the reader from one point of impact to the next without them ever feeling overwhelmed or lost.
Turning Data Into Compelling Insights
We all know financials and program metrics are crucial, but let's face it—a spreadsheet full of numbers can make anyone's eyes glaze over. This is where infographics and data visualization become your secret weapons. They translate dense data into simple, digestible visuals that tell a story anyone can follow.
For example, a pie chart is the perfect way to show exactly how donor funds were used across programs, admin, and fundraising. A simple bar graph can deliver a powerful punch by illustrating your growth in services year-over-year. These visuals make your impact real, quantifiable, and, most importantly, memorable.
You don't have to be a graphic designer to do this well. Platforms like Canva offer fantastic, easy-to-use templates built specifically for reports.
Just look at how these templates use a clear visual hierarchy, bold typography, and a smart mix of photos and graphics. They’re designed to present information in an engaging way, whether someone is reading on a desktop or their phone. Smart layout choices like these ensure your key takeaways stick.
Sharing Your Report to Engage Supporters
Creating a beautiful, impactful report is just the first step. If that masterpiece just sits on your website or gets buried in a single mass email, you’re leaving its true potential on the table. A truly effective nonprofit annual report format needs an equally thoughtful distribution strategy to turn it from a static document into a powerful engagement tool.
Think of your report less as a single document and more as a content goldmine. Its stories, data, and visuals can be sliced, diced, and repurposed across all your channels to connect with different parts of your audience. Moving beyond a simple PDF attachment is the key to getting the most mileage out of all your hard work.
Launch Your Report with a Dedicated Hub
Your report deserves its own home. Instead of just linking to a downloadable PDF, build a dedicated landing page or even a simple microsite for it. This gives you a central, shareable link you can promote and track all year long.
This digital hub is the perfect spot to showcase the best parts of your report in a more dynamic way. You could embed a welcome video from your executive director, feature a powerful infographic that tells a story at a glance, or pull out a single, compelling quote from a client testimonial.
This approach lets supporters get the key takeaways instantly, with the option to download the full report if they want to dig deeper. It’s all about meeting your audience where they are and respecting their time.
A Multi-Channel Promotion Checklist
Once your landing page is live, it’s time to spread the word. A coordinated promotional push ensures your report reaches everyone, from major donors to casual social media followers. This approach reinforces your fundraising efforts by keeping your community informed and engaged. For more ideas, you can explore our detailed guide on nonprofit fundraising best practices.
Here’s a simple checklist to guide your launch:
Segment Your Email Campaign: Don't blast the same email to everyone. Craft personalized messages for different groups. Major donors might get a personal note from the ED, while volunteers could receive a message that specifically highlights their collective impact.
Create Social Media Snippets: Pull out the most powerful statistics, quotes, and photos from your report. Turn them into a series of eye-catching social media graphics, short videos, or even Instagram Stories to share over several weeks.
Repurpose Content for Your Blog: Take one of your most compelling impact stories from the report and expand it into a full blog post. This gives the story new life and provides another way for people to find your work.
Activate Your Board and Partners: Equip your board members and key partners with a simple toolkit. Give them pre-written social media posts and email copy to make it incredibly easy for them to share the report with their own networks.
Frequently Asked Questions About Annual Report Formats
When you're putting together a modern nonprofit annual report format, a few common questions always seem to pop up. Nailing these details can be the difference between a report that gets read and one that gets ignored. Let's walk through some practical answers to help you create a report that truly connects with your supporters.
How Long Should a Nonprofit Annual Report Be?
Good news: the days of the massive, 30-page annual report are long gone. In today's world, less is definitely more. If you're creating a digital-first report, your sweet spot is somewhere between 8-15 pages. The goal is to give a solid overview without overwhelming your reader.
A shorter, punchier report has a much better chance of being read from cover to cover. Focus on compelling stories and high-impact visuals instead of dense paragraphs. This will keep your audience engaged and make sure your most important messages actually stick.
Do We Need Both a Print and Digital Version?
This really comes down to knowing your audience, but for most nonprofits, a digital-first approach is the way to go. The reality is that most of your donors and supporters expect to find information online, accessible from anywhere. Your main version should be an interactive PDF or even a dedicated webpage.
From that digital master copy, you can easily create a streamlined, print-friendly one-pager or a summary brochure. These are perfect for handing out at fundraising events or for that small group of donors who still prefer a physical copy. This approach saves a ton on printing costs and puts your energy where it will have the most impact.
The most crucial section of your report isn't the financials—it's your Impact Stories. This is where you bring the numbers to life and show the real-world change you're creating. These are the stories that motivate people to give again.
How Can We Make Our Financial Data Easy to Understand?
Being transparent with your finances is non-negotiable for building trust, but let's be honest, nobody wants to squint at a complicated spreadsheet. The trick is to visualize your data in a way that's simple and clear. Ditch the overwhelming detail and focus on clarity.
Try using straightforward visuals to make your financial info easy to digest:
- Pie charts are great for breaking down where the money went (e.g., program services vs. administrative costs vs. fundraising).
- Bar graphs work well for showing growth over the years or comparing where your funding came from.
- Simple infographics with icons can spotlight key figures, like total funds raised or your cost per person served.
Always include short, plain-language captions to explain what the numbers actually mean. You want someone to be able to understand your financial health at a single glance.
Fundsprout is an AI-powered platform built to help nonprofits secure the funding they need to grow. We provide the tools to find the right grant opportunities and craft proposals that win, making your fundraising more effective. Find out more at https://www.fundsprout.ai.
Try 14 days free
Get started with Fundsprout so you can focus on what really matters.