A Guide to Nonprofit Impact Measurement
Master nonprofit impact measurement. This guide offers practical frameworks, data strategies, and reporting tips to prove your mission and secure funding.

Abdifatah Ali
Co-Founder
Nonprofit impact measurement is all about connecting the dots between your daily work and the real, lasting change you want to see. It’s the practice of gathering and analyzing information to prove that your programs are actually making a difference for the people and communities you serve.
Why Impact Measurement Is a Must-Have, Not a Nice-to-Have
In the world of nonprofits, a compelling story can open hearts. But in today's crowded funding environment, it's hard data that opens wallets. Funders aren't just donating anymore; they're investing in a "Return on Mission." They want to see clear evidence that their money is fueling tangible, positive change.
This isn't just a trend—it's the new standard. Relying on passion and anecdotes alone is no longer a sustainable strategy. Shifting from simply describing your activities to proving your effectiveness has become essential for survival and growth.
Data: The New Language of Trust
Think of solid impact data as the currency of trust in the nonprofit sector. When you can clearly show how your efforts lead to specific, measurable improvements, you build incredible credibility with funders, your board, and even your own team.
An evidence-based approach helps you:
- Win More Grants: Strong impact data answers the number one question on every grant reviewer's mind: "Will this investment actually work?"
- Sharpen Your Strategy: Measurement is a powerful feedback loop. It shows you what’s hitting the mark and what isn’t, allowing you to focus your limited resources where they’ll do the most good.
- Rally Your Supporters: Sharing concrete wins with your community, volunteers, and staff builds momentum and reinforces a shared sense of purpose.
The pressure is on. Recent studies show that 70% of funders now require proof of impact before writing a check. Nonprofits are feeling it, too, with 85% of organizations saying that demonstrating their impact is a top priority for attracting support. You can explore more data on these trends and what they mean for modern fundraising.
At its heart, impact measurement is about translating your mission into a story backed by proof. It’s how you turn a powerful goal like “empowering youth” into a verifiable fact like “a 40% increase in high school graduation rates for kids in our program.”
This mindset moves you past reporting on what you did (outputs) and toward showcasing what changed because of it (outcomes).
Understanding Outputs Versus Outcomes
Distinguishing between outputs and outcomes is the single most important concept in impact measurement. Outputs are the direct products of your activities—the "what." Outcomes are the changes that result from those activities—the "so what?" Grasping this difference is fundamental to telling a powerful impact story.
The table below breaks it down.
Ultimately, funders invest in outcomes, not outputs. While counting the 50 workshops you held is a good start, showing that attendees reported a 75% increase in job-readiness skills is what truly demonstrates your value and secures long-term support.
Building Your Impact Story with a Theory of Change
So, we've talked about the crucial difference between what you do (outputs) and the real-world change you create (outcomes). The next logical question is: how do you actually get from one to the other? How can you be sure your hard work is leading to the impact you hope for?
That’s where a Theory of Change (ToC) comes in. Far from being some dry, academic exercise, it's the narrative that explains the “why” behind your work.
Think of it as the master recipe for your mission. Your inputs are the ingredients (staff time, funding, supplies). Your activities are the steps you take (running workshops, holding counseling sessions). The finished cake fresh from the oven is your output (say, 50 people trained). But the real magic—the outcome—is the look of delight on your guests' faces as they enjoy it (participants feel more confident and land new jobs). A ToC is that complete recipe card, showing anyone how your resources and actions combine to create something wonderful.
This simple idea—story, backed by data, leading to trust—is the engine of nonprofit survival.
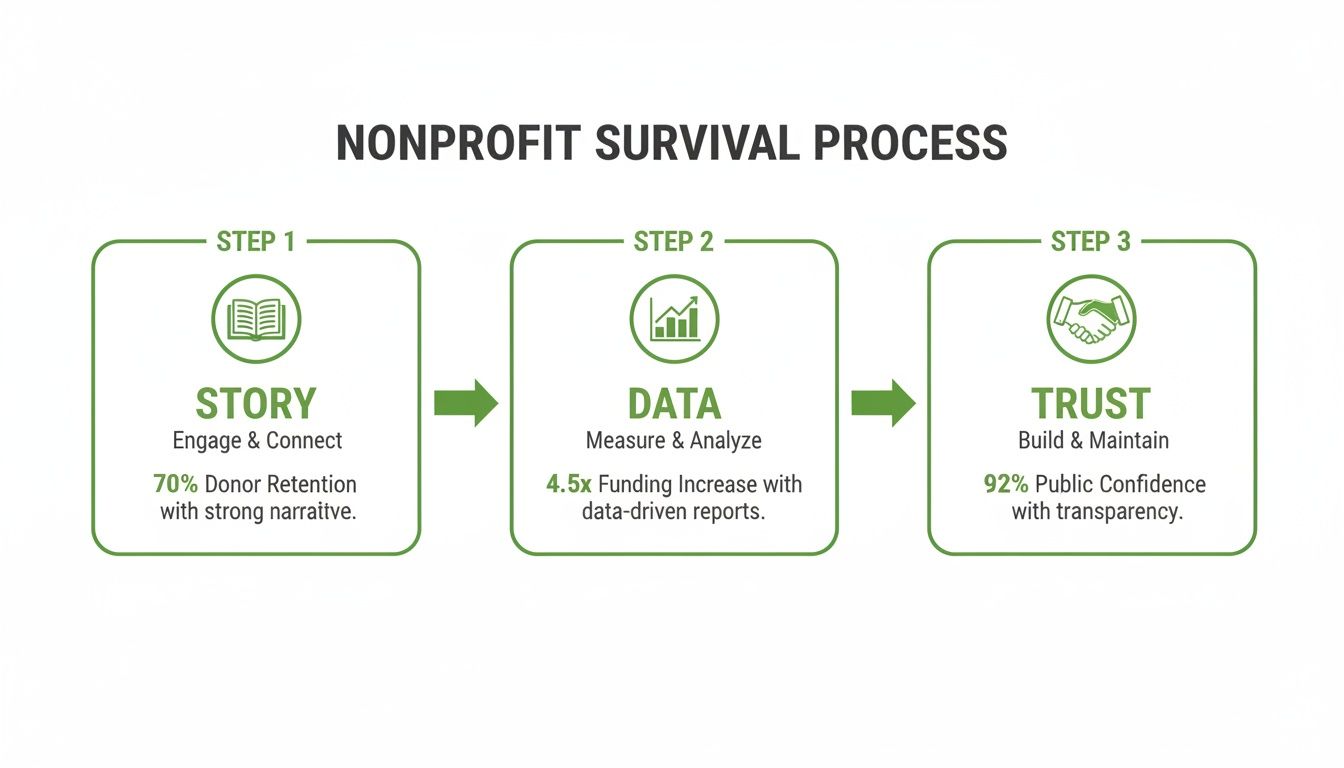
It all starts with a compelling story. But it's the data that gives that story credibility, ultimately building the rock-solid trust you need from funders, partners, and the community to keep going and grow.
From Big Ideas to a Practical Blueprint
A Theory of Change is built by looking at your ultimate goal and working backward, step-by-step. This process forces you to articulate the assumptions you’re making about how change happens and to map out the chain of events required to achieve your vision.
Let's say your long-term dream is to reduce youth unemployment in your city. Your ToC would map out the journey like this:
- Your Destination (Long-Term Goal): Youth unemployment rates have dropped significantly.
- The Big Milestone (Medium-Term Outcome): More young people are getting hired and, just as importantly, staying in their jobs.
- The First Steps (Short-Term Outcome): Young people develop concrete job-readiness skills and build the confidence to succeed.
- What You Produce (Outputs): 100 youth successfully complete our interview skills workshop.
- What You Do (Activities): We run weekly workshops and provide one-on-one mentorship.
- What You Need (Inputs): We need skilled facilitators, a safe meeting space, and grant funding to make it happen.
This creates a clear "if-then" pathway that connects your daily work to your highest ambition. If we provide these workshops, then youth will gain new skills. If they gain skills, then they'll be better equipped to find and keep a job.
A well-crafted Theory of Change is more than a document—it’s a strategic compass. It ensures every activity your team undertakes is directly tied to a measurable outcome, preventing "mission drift" and focusing your resources for maximum effect.
The Logic Model: Your Practical Roadmap
If a Theory of Change is your strategic overview—the "why"—then a Logic Model is its boots-on-the-ground partner. It’s the "how," "what," and "who" laid out in a clear, visual format.
A logic model translates your ToC into a practical chart, organizing your program's components into a straightforward flow. It’s an incredibly useful tool for day-to-day program management and is something funders love to see. It neatly lays out the resources you're using, the activities you're running, and the specific short, medium, and long-term outcomes you expect. To get started, check out our guide on how to create a logic model for program evaluation.
Taking the time to build a logic model helps you in a few key ways:
- Get Everyone on the Same Page: It ensures your whole team, from volunteers to the executive director, sees exactly how their daily tasks contribute to the bigger picture.
- Pinpoint Your Metrics: It makes it obvious what you need to measure at each stage. You'll see exactly where to track attendance (an output) versus skill acquisition (an outcome).
- Speak a Funder's Language: It gives funders a concise snapshot of your program that proactively answers their biggest questions about strategy and accountability.
By developing your Theory of Change first and then a corresponding Logic Model, you're essentially creating the blueprint for your entire impact measurement system. With this foundation in place, you'll know exactly what data to collect, because every single metric will link directly back to a critical piece of your impact story.
Choosing Mission-Critical KPIs and Metrics
Once you've mapped out your Theory of Change and Logic Model, you've got your strategic blueprint. Now it's time to shift from the "why" of your work to the "what"—the specific, measurable proof points that show you're making a difference. This is where we get practical. The goal isn't to measure everything under the sun, but to zero in on what truly matters.
This brings us to Key Performance Indicators (KPIs) and metrics, the heart of hands-on impact measurement. Before you start picking them, it's crucial to get a handle on the difference between them. This guide on understanding the difference between KPIs and metrics is a great resource. The simplest way to think about it is that while all KPIs are metrics, not every metric you track is a KPI.
Think of it this way: a general metric might be the number of people who visit your website. That's nice to know, but it doesn't say much about your mission. A real KPI, on the other hand, would be the percentage of visitors who sign up for your volunteer list. Why? Because that number is directly tied to a strategic goal of boosting community engagement. It tells you if you're actually succeeding.
Aligning Metrics with Your Mission
I've seen it time and time again: the most common mistake nonprofits make is choosing metrics simply because they're easy to count. Tracking how many flyers you hand out is straightforward, but it tells you absolutely nothing about your real-world impact.
The best KPIs are born directly from your Logic Model. They should be clear, direct lines to the outcomes you're trying to achieve.
A powerful KPI will always check these boxes:
- Relevant: Does it directly measure progress toward a core outcome you identified in your Theory of Change?
- Feasible: Can your team realistically gather this data without needing a PhD in statistics or a mountain of resources?
- Compelling: Is this a metric that will tell a powerful story to funders, your board, and the community you serve?
A KPI should be a signpost on your journey to impact. It needs to answer the question, "Are we on the right track?" immediately, without needing a five-minute explanation. A single, powerful KPI is far more persuasive than a dozen fluffy, irrelevant metrics.
Quantitative vs Qualitative KPIs
A truly solid impact measurement strategy never relies on just one type of data. You need a healthy mix of both quantitative and qualitative information. The numbers tell you what happened, but the stories tell you why it mattered.
Quantitative KPIs are your hard numbers. They are measurable, specific, and fantastic for showing scale and tracking change over time. Think percentages, raw counts, and rating scores.
Qualitative KPIs are the human stories. They deliver context, depth, and the emotional resonance behind the numbers. You’ll find these in interviews, testimonials, and open-ended survey questions.
Let's say you run an after-school tutoring program. A quantitative KPI might be, "70% of students increased their math scores by one letter grade." That’s a powerful, clear result. But pair it with a qualitative insight—a testimonial from a student saying, "For the first time, I feel confident enough to raise my hand in class"—and you've got something truly compelling. One gives you the proof, the other gives you the purpose.
Sample KPIs by Nonprofit Program Area
Of course, every nonprofit's KPIs will be tailored to its specific mission. Still, looking at examples from other sectors can be a great way to get the wheels turning and help you think about what’s possible for your own programs. The real magic happens when you blend metrics that track both the "how much" and the "how well."
Here are a few examples to spark some ideas:
Sample KPIs by Nonprofit Program Area
By choosing KPIs that are directly wired to your mission, feasible for your team to track, and compelling to your audience, you turn measurement from a chore into a storytelling superpower. These carefully selected indicators will become the backbone of your reports, grant proposals, and communications—giving you the undeniable proof you need to show the world the incredible work you do.
Practical Data Collection without the Headache
Alright, you've got your strategy mapped out. Now comes the part that often makes nonprofit leaders nervous: actually collecting the data. It's easy to assume this requires a massive budget or a data scientist on staff, but I'm here to tell you that’s a myth.
Effective data collection is all about being clever and resourceful. You don’t need expensive tools to get the job done. The real magic happens when you blend the quantitative data (the numbers) with the qualitative data (the stories). Let's walk through how to do this without getting a headache.
Gathering Your Quantitative Data
Quantitative data is your hard evidence. It answers the "what" and "how much" of your impact, giving you concrete, measurable proof of your work. The trick is to keep it simple and bake the collection right into your existing program activities.
Here are a few high-impact methods that won't break the bank:
- Surveys and Questionnaires: Tools like Google Forms are perfect for this and completely free. Think simple pre- and post-program surveys to measure a change in knowledge, skills, or even attitudes. A short, five-question survey before and after a workshop can give you incredibly powerful data.
- Attendance and Participation Logs: This is the simplest form of output data, but it's absolutely vital. A basic spreadsheet or even a physical sign-in sheet tracks who is showing up. This consistency demonstrates program demand and your overall reach.
- Standardized Assessments: If your program teaches a specific skill—like financial planning or literacy—using a simple, pre-existing assessment tool adds a ton of credibility. It gives you standardized data showing exactly how much your participants have progressed.
These straightforward methods are what produce the concrete numbers funders love to see, like "85% of workshop attendees reported an increase in financial literacy."
Capturing the Stories with Qualitative Data
While numbers give you proof, stories give you purpose. Qualitative data is where you find the human side of your work, adding an emotional depth that raw statistics just can't match. This is how you uncover the "why" behind your results.
Don’t underestimate the power of a single, well-told story. One compelling quote from a program participant can often be more memorable to a funder than a page full of statistics. It brings your impact to life.
Here are some great ways to gather these essential narratives:
- Testimonials and Success Stories: Get into the habit of asking participants for their thoughts. You can do this with a simple form, a quick follow-up email, or just an informal chat after a program wraps up.
- Semi-Structured Interviews: Take 15-20 minutes to sit down with a few participants. Come prepared with a handful of open-ended questions like, "What was the biggest change for you?" or "How has this program impacted your daily life?"
- Focus Groups: Bringing a small group of 5-7 participants together for a guided conversation is fantastic for uncovering shared experiences and common themes. This is also a goldmine for feedback that can help you improve your programs. The insights gathered are invaluable when preparing a needs assessment for your next grant proposal. You can learn more about effective methods in our article on community needs assessment tools.
Setting Baselines and Using Simple Sampling
Let’s quickly demystify two concepts that sound complex but are actually very straightforward: baselines and sampling.
A baseline is simply your starting point. It’s the data you collect before your program or intervention begins. That pre-program survey we mentioned? That’s your baseline. Without it, you have no way to prove your program was the reason for the change you observed.
Sampling is just the idea that you don't need to talk to everyone to get meaningful information. If you have a program with 100 participants, conducting in-depth interviews with a randomly chosen group of 10 will give you a very strong and representative picture of the overall experience. This approach saves an enormous amount of time while still delivering rich, insightful data.
By mixing these practical, low-cost data collection techniques, any nonprofit can build a powerful system for nonprofit impact measurement. You'll end up with the hard numbers to prove your effectiveness and the compelling stories that showcase the heart of your mission.
Using Technology to Streamline Impact Reporting
Let's be honest, the thought of tracking data can feel overwhelming. But the days of wrestling with scattered spreadsheets and tedious manual entry are behind us. Today's tools make nonprofit impact measurement genuinely accessible, even if you don't have a data analyst on staff.
The old way of measuring impact was a time-suck, plain and simple. It meant hours spent digging through different files, trying to piece together a story. That approach just isn't sustainable for busy teams. An automated, integrated system is no longer a luxury—it's the key to efficient reporting that frees up your people to do what they do best: deliver on your mission.
Integrating Your Data for a Clearer Picture
One of the biggest game-changers has been the shift to integrated platforms. Instead of keeping your program attendance in one system and your fundraising data in another, these tools bring everything together. This finally gives you a unified view of your work, drawing a straight line from your team’s efforts to the funding that makes it all possible.
Think about your next grant report. With an integrated system, you no longer have to manually pull participant numbers from one spreadsheet and pull-quotes from a separate Word doc. You can instantly:
- Connect activities to funding: See exactly which grants are fueling which program outcomes.
- Automate KPI tracking: Watch your dashboards update in real time as your team logs new information from the field.
- Simplify reporting: Generate detailed reports with a few clicks, pulling all the necessary data from across your entire organization.
This transforms your data from a scattered collection of files into a powerful, centralized asset.
The most powerful shift is moving from data as an administrative burden to data as a storytelling engine. Technology makes this shift possible for everyone, not just large organizations with big budgets.
The Rise of AI in Nonprofit Reporting
Artificial intelligence is also making a huge difference in day-to-day efficiency. This isn’t science fiction; these are practical tools designed to solve real problems. In fact, a remarkable 58% of nonprofits are already using AI in their digital communications, putting them ahead of many for-profit businesses. This adoption helps organizations better articulate their "Return on Mission" by connecting digital efforts directly to social value, and you can discover more insights on this trend.
AI-powered tools can give you a serious edge in your grant workflow. Imagine an RFP analyzer that scans a dense grant application and instantly flags the key metrics and outcomes the funder cares about. Right away, you know exactly how to align your proposal with their priorities.
AI assistants can also help you build compelling, data-driven narratives. By feeding the AI your program data and success stories, it can help you weave together your numbers and your human impact into a persuasive story. Some platforms can even populate funder report templates automatically, saving countless hours and minimizing the risk of error. By embracing these tools, your team can spend far less time on paperwork and more time making a difference.
Turning Data into Reports That Funders Love

All that hard work collecting data means nothing if you can’t communicate what you’ve found. This is where your nonprofit impact measurement truly comes to life. A good impact report does more than just check a box for a grant—it’s your best chance to prove your worth, build trust, and turn your results into a powerful fundraising asset.
The secret is to stop thinking of it as a data dump and start seeing it as a story. When you combine compelling human stories with hard numbers, you create something that connects with funders on both an emotional and a rational level. Suddenly, reporting isn’t a chore; it’s a strategic opportunity.
A Simple Structure for High-Impact Reports
Let’s be honest: funders are swimming in paperwork. Your report has to cut through the noise and get straight to the point. The best way to do that is with a simple, clear structure that tells a story.
This easy-to-follow, four-part framework helps funders connect the dots:
- Lead with a Human Story: Start small and personal. Tell a powerful anecdote about one person whose life was changed by your work. This creates an immediate emotional hook that makes the data matter.
- Show the Supporting Data: Now, zoom out. After sharing that one person’s journey, use simple charts to show this isn't an isolated case. This is where you bring in your key metrics, like "85% of participants achieved a similar outcome."
- Explain What You Learned: This is where real trust is built. Don't be afraid to be transparent about what worked and what didn't. Discuss the insights you gained and how you're using them to make your programs even stronger.
- Outline Your Next Steps: Finish by looking ahead. Show funders you’re a forward-thinking organization by explaining how you’ll apply these lessons to set new goals and keep driving your mission.
Tailoring Your Story for Different Funders
While your data is your data, how you present it should change with your audience. A large foundation focused on systemic change will want to see the nitty-gritty details of your long-term outcomes. A local community donor, on the other hand, might be more interested in a collection of powerful testimonials from their own neighborhood.
Always go back to the original grant agreement. What specific outcomes did they care about? Make sure your report directly answers those questions, highlighting your progress against their stated goals. For a complete guide on pulling these documents together, check out our tips on crafting a nonprofit annual report format.
Your impact data tells a story of change. By framing that story with both a human face and clear, undeniable evidence, you do more than just meet a requirement. You inspire confidence and secure the partnership needed to continue your vital work.
To make your data really pop, it pays to follow some basic data visualization best practices. A few clean, well-designed charts will always be more effective than a dense spreadsheet or a wall of text. At the end of the day, a great report gives a funder a clear and confident answer to their most important question: "Was our investment worth it?"
Frequently Asked Questions About Nonprofit Impact Measurement
Even with a solid plan, actually starting your impact measurement journey can bring up a lot of questions. It’s easy to get stuck wondering about the "what ifs." Let's tackle some of the most common concerns we hear from organizations just like yours.
How Do We Start With a Very Small Budget?
You don’t need a five-figure software budget to get started. The secret is to start small and smart, focusing only on what’s absolutely essential to proving your mission works. Forget trying to measure everything all at once.
Instead, here’s a simple, practical approach:
- Pick Your Battles: Choose just 2-3 core outcomes that get right to the heart of your program's purpose.
- Use What’s Free: You can accomplish a surprising amount with free tools. Google Forms is fantastic for simple pre- and post-program surveys, and a basic spreadsheet is all you need for tracking attendance or other simple numbers.
- Go for Quick Wins: Don’t underestimate the power of a few good stories. Conduct quick testimonial interviews over the phone or just after a session wraps up. A few powerful quotes can bring your data to life.
The goal isn't complexity; it's consistency. Proving your impact with a few well-chosen data points is far more powerful than trying to measure a dozen things and never finishing.
What If Our Data Shows a Program Isn't Working?
This is a deep-seated fear for many, but it’s time to reframe it. Getting data that shows a program isn't hitting the mark isn't a failure—it's a discovery. In fact, many funders see this as a sign of a mature and self-aware organization.
When you find out something isn’t working as you’d hoped, you have a golden opportunity. Don't try to hide the data. Use it to build trust and show your commitment to doing better.
Transparency is your greatest asset here. Frame negative findings as a learning moment that will make your organization stronger and more effective in the long run.
Share what you learned, clearly explain the changes you’re making because of that data, and outline how you expect those tweaks to produce better outcomes. This kind of honesty shows funders you’re a strategic partner dedicated to real impact, not just to reporting good news.
How Much Time Should We Dedicate to This?
There’s no magic number here. The most successful organizations don't treat data collection as a separate, time-consuming chore. They weave it directly into their existing activities. For example, making a five-minute feedback survey a standard part of wrapping up any workshop or event.
As a rule of thumb, start by budgeting just a few hours a month for basic analysis and reporting. Once you have simple systems in place and your team gets used to the rhythm, you'll be surprised how efficient it becomes. The key is to start small and let the process grow with you.
Can We Measure Long-Term Impact with Short-Term Programs?
Absolutely. While you can't always track someone for a decade after a three-month program, you can measure powerful leading indicators. These are the crucial short-term changes that are logically and often provably linked to that long-term success you’re aiming for.
Think about it this way: a short workforce development program can’t immediately prove a participant will have long-term career stability. But it can measure things that are strong predictors of that success:
- Increased confidence in interview skills (measured with a simple survey).
- The number of job applications they submit (tracked with a quick follow-up call or email).
- The job placement rate within 90 days of finishing the program.
These metrics tell a compelling story of progress right now. They provide the timely, convincing evidence funders need to see that their investment is already making a difference.
Ready to transform your impact measurement from a chore into a strategic advantage? Fundsprout is your AI-powered grant success platform. We help you pinpoint the exact metrics funders want, build data-driven narratives for your proposals, and auto-populate report templates to save you countless hours. See how it works at https://www.fundsprout.ai.
Try 14 days free
Get started with Fundsprout so you can focus on what really matters.