Your Guide to the Perfect Annual Reports for Nonprofits Template
Transform your annual report from an obligation to an opportunity. Use our annual reports for nonprofits template to tell your story and inspire donors.

Abdifatah Ali
Co-Founder
An annual reports for nonprofits template is far more than a document you file away for compliance. It's a powerful storytelling tool that brings your mission's impact to life, turning raw data into a narrative that connects with your supporters on a human level. A good template gives you a framework to showcase your achievements, financials, and future plans, transforming a yearly requirement into a cornerstone of your fundraising and engagement strategy.
Beyond Compliance: Why Your Annual Report Matters

For many nonprofit leaders, putting together the annual report feels like a chore—just one more box to check off the compliance list. If that’s how you see it, you're missing out on a huge opportunity. Your annual report is one of the most powerful assets you have for building trust, celebrating your wins, and securing support for the year ahead.
Think of it as your nonprofit’s yearbook. It’s your chance to highlight the most important milestones, share stories that truly inspire, and give a heartfelt thank you to the community that made everything possible. It’s the single best way to answer the one question every donor has: “What did you do with my money, and what difference did it make?”
A Tool for Trust and Transparency
In a world where donors are more careful than ever about where their money goes, transparency isn't just a buzzword; it's essential. A thoughtfully prepared annual report does more than just present numbers. It weaves your financial statements and program metrics into a clear story that proves you’re a responsible steward of the resources you’ve been given.
This level of openness builds deep, lasting trust. When donors can draw a straight line from their contribution to a real-world outcome—like the number of meals served or the miles of trails maintained—their belief in your mission solidifies. That belief is what turns a one-time donor into a lifelong supporter.
Engaging Your Donor Community
The truth is, individual donors are the lifeblood of most nonprofits. Recent data from Giving USA shows that charitable giving in the U.S. reached an incredible $592.50 billion, and individuals accounted for a massive $374.40 billion of that—a full 67% of the total. This just goes to show how critical it is to connect with people on a personal level, and your annual report is the perfect way to do it.
To help you get started, here's a look at the key sections that make an annual report both comprehensive and compelling.
Key Components of an Impactful Nonprofit Annual Report
A summary of the essential sections every nonprofit annual report should include to effectively communicate its story and financial health.
Ultimately, a strong annual report does more than just look back at the past year.
An effective annual report does more than just report on the past; it inspires action for the future. It transforms a yearly obligation into a year-round engagement opportunity that deepens relationships and fuels your mission.
When you shift your perspective and treat your annual report as a vibrant story of impact, it becomes something people actually want to read. It turns into a shareable tool that can attract new donors, impress corporate partners, and re-energize your existing supporters, setting you up for another year of incredible work.
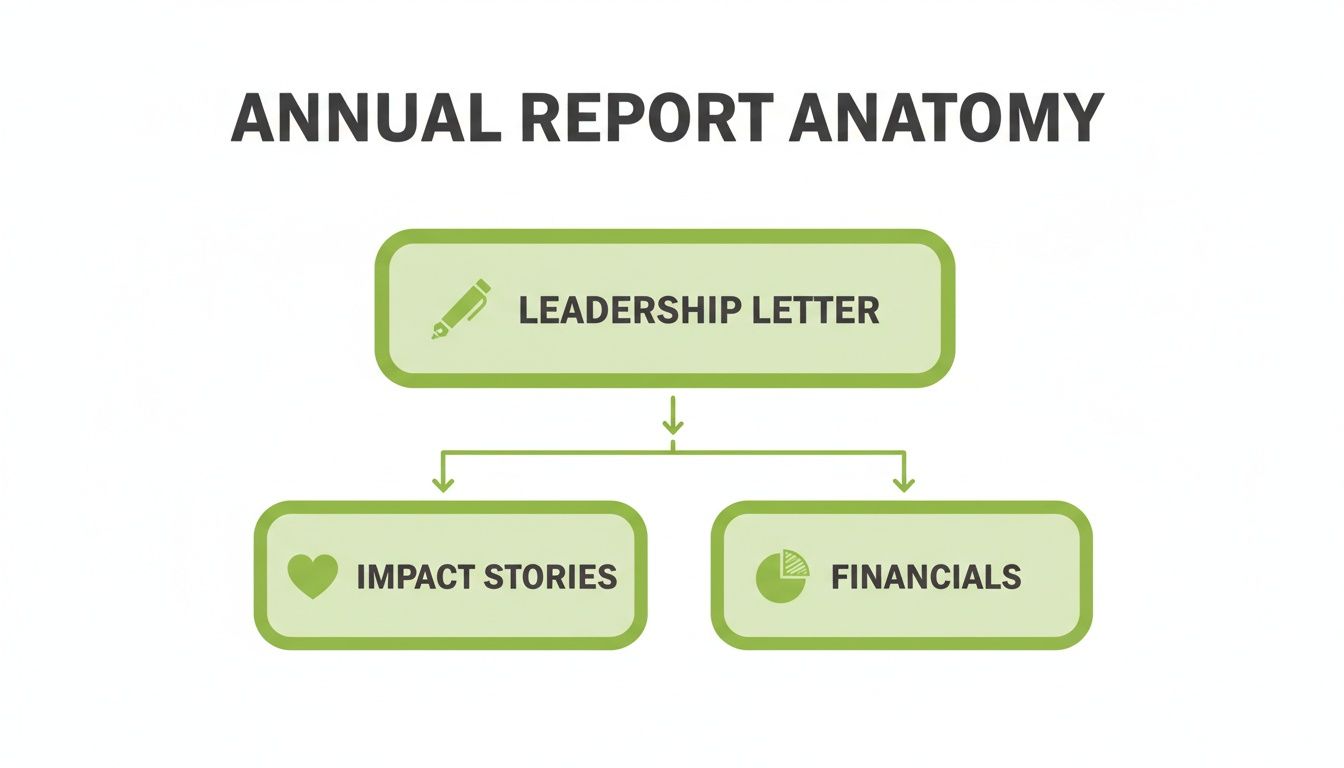
Anatomy of an Impactful Annual Report Template
A great annual report template for nonprofits is so much more than a fill-in-the-blanks document—it’s the strategic framework for telling your story. Think of it like a blueprint for a house. Without a solid plan showing where the foundation, walls, and rooms go, you’d end up with a confusing, unstable mess. The best annual reports rely on strong structure in writing to turn a mountain of information into something clear and valuable for your audience.
Let’s walk through the essential sections of a great template. We won't just cover what to include, but why each piece is so critical for building trust and inspiring your supporters to act.
The Opening: Your Letter from Leadership
This isn't just a formality; it’s your first handshake with the reader. The Letter from Leadership, usually written by your Executive Director or Board Chair, is what sets the emotional tone for the entire report. It needs to feel personal, authentic, and forward-looking.
Use this space to:
- Share a high-level vision: What was the big theme of the year? Was it a year of growth, resilience, or innovation? Sum it up right at the start.
- Express genuine gratitude: Thank your donors, volunteers, and staff for the specific things they did. Make them feel seen.
- Connect back to the mission: In a heartfelt way that numbers alone can't, remind everyone why your work is so important.
This opening immediately shifts the report from a dry document into a personal message from one human to another. It makes your readers feel valued from the very first page.
The Core: The Program and Impact Section
This is where your mission truly comes to life. This section goes beyond abstract goals to show concrete, tangible results. You’re proving that your organization doesn’t just have a great mission statement—it actually delivers on its promises. The real goal here is to draw a straight line from a donor’s contribution to a real-world outcome.
A strong template will guide you to include:
- Quantitative Metrics: These are your hard numbers. Think "served 5,000 hot meals" or "provided 250 shelter nights." Be specific and crystal clear.
- Qualitative Stories: This is the heart of your report. Share a powerful testimonial or a short case study about a real person whose life was changed by your work. One compelling story often has more emotional weight than a page full of statistics.
By blending hard data with human stories, you satisfy both the head and the heart. Donors can see the logical proof of your effectiveness and feel the emotional resonance of their impact.
When you combine these two elements, you create a powerful narrative that shows both the scale and the depth of your impact. It’s the difference between saying "we helped people" and showing exactly how.
The Foundation: The Financial Summary
Transparency is the absolute bedrock of donor trust. This section is your chance to demystify your finances and show stakeholders you’re a responsible steward of their investment. The key is to avoid overwhelming them with dense spreadsheets. A good template will push you toward simplicity and clarity.
Your financial summary should feature:
- A Simple Revenue Breakdown: A simple pie chart is perfect for showing where your funding comes from (e.g., individual donations, grants, corporate sponsorships).
- An Expense Breakdown: Show how you put those funds to work. Make a clear distinction between program costs, administrative overhead, and fundraising expenses. A healthy ratio here builds incredible credibility.
- A Narrative Explanation: Don't just show the numbers—explain them. Add a short paragraph of context. For instance, if admin costs are up, explain that it was due to a one-time investment in new technology that will boost efficiency for years. Context is everything.
For a deeper dive into managing the numbers that fuel your mission, our guide on creating a nonprofit program budget template offers a structured approach to tracking and presenting your financials with confidence.
The Community: Donor Recognition and Team Lists
At its core, your annual report is a celebration of community. Recognizing the people who make your work possible isn’t just polite; it’s a vital part of showing appreciation and fostering long-term loyalty. This section should honor everyone, from major donors to the dedicated staff and board members leading the charge.
Keep this section organized:
- Donor Tiers: Group donors by giving levels (e.g., "Partners Circle: $1,000+," "Friends: $500-$999"). This is a great way to acknowledge contributions of all sizes.
- Board and Staff Lists: Including names and titles literally puts a human face on your organization and reinforces its professional leadership.
The Future: Your Call to Action
Finally, every great annual report must look forward. You’ve just spent pages inspiring readers with your past accomplishments; now you need to give them a clear and compelling way to join you on the journey ahead. Don't let that momentum fizzle out. End with a powerful call to action.
Make it incredibly easy for them to:
- Donate: Include a direct link or a QR code to your giving page.
- Volunteer: Share details on upcoming opportunities.
- Connect: List your website URL and social media handles.
This final section transforms your report from a look back into a forward-thinking tool for engagement, making sure the story of your impact continues for another year.
Turning Data Into Compelling Impact Stories
Let's be honest: raw numbers on a spreadsheet don't pull at anyone's heartstrings. A donor might see "1,000 meals served," but what they truly connect with is the story of 1,000 families sitting down to a warm, nutritious dinner together.
That's the art of impact reporting. It's about moving beyond sterile statistics and showing the real, human-level change your organization makes happen. Your annual report needs to do more than just tell people what you did; it has to show them.
As you can see, the most compelling reports are a careful blend of personal leadership, powerful stories, and transparent financials. Each part reinforces the others to build a solid foundation of trust.
Blending Metrics with Mission
Think of every data point as a single frame in a movie. Your job is to string those frames together to tell a story that captivates your audience. This means pairing every key metric with a real-world example, a powerful photo, or a heartfelt quote.
- Quantitative Data: This is the hard evidence—the "what." It's your funds raised, volunteer hours logged, or clients served. This data proves your efficiency and your reach.
- Qualitative Data: This is the emotional core—the "so what." It comes through in beneficiary testimonials, short case studies, and images of your work in action. This is what demonstrates your true impact.
When you present these two together, you appeal to both the head and the heart. Donors can see the logical proof of your effectiveness while also feeling the emotional weight of their contribution.
Making Financials Digestible
Financial transparency is absolutely essential, but let's face it—no one enjoys squinting at dense spreadsheets. The best annual reports make financial information accessible and easy to understand at a glance using clean, simple visuals.
Instead of a data table, try using:
- Pie Charts to show where your funding comes from or how you allocate expenses across programs, administration, and fundraising.
- Simple Bar Graphs to illustrate growth, like an increase in the number of people served year-over-year.
- Callout Boxes to highlight a key financial win. A simple statement like, "92 cents of every dollar donated went directly to program services," speaks volumes about your fiscal responsibility.
By simplifying the presentation, you turn your financials into a point of confidence, not a source of confusion. If you're struggling to identify what data matters most to your audience, using community needs assessment tools can help you zero in on what truly resonates.
Highlighting the Power of Recurring Donors
Sustained giving is the lifeblood of any nonprofit. Your annual report is the perfect place to celebrate the incredible impact of your monthly and recurring donors. Their steady contributions provide the stability you need to plan for the future and grow your programs.
An annual report shouldn't just be a look back; it should be a powerful retention tool. By clearly showing the long-term impact made possible by sustained giving, you reinforce the value of their loyalty and inspire them to continue their support.
This is more critical than ever. While 57% of donors are enrolled in some kind of recurring giving program, overall donor retention has dropped by 4.6%. Even more telling is that only 19% of first-time donors ever give again.
Your report is your chance to change that. By weaving together numbers, stories, and visuals, it becomes more than a summary—it becomes a testament to your mission's vitality.
Getting Your Report Designed and Into the Right Hands
Let’s be honest: an amazing annual report that sits on a shelf collecting dust has zero impact. After pouring all that work into crafting your story, the final steps—design and distribution—are what actually get your message in front of donors, partners, and your community. This is where your report stops being a document and starts being a real marketing tool.
Think of it like this: your content is the engine, but the design is the car's body. Good design isn’t about being flashy. It’s about making the information a pleasure to read. When your report looks good, you're respecting your reader's time and keeping them hooked from cover to cover.
Design Tips for Non-Designers
You don't need a design degree to create a report that looks fantastic. If you stick to a few core ideas and use a solid annual reports for nonprofits template, you can easily produce a polished, professional document.
- Stick to Your Brand: Use your nonprofit’s official colors, fonts, and logo everywhere. Consistency is the name of the game here; it builds trust and makes your report instantly recognizable.
- Make It Easy to Read: Go for clean, simple fonts and don't be afraid of white space. Breaking up big chunks of text with headings, short paragraphs, and lists makes the whole thing feel way less intimidating.
- Use Great Photos: Nothing tells a story like a powerful image. Use high-quality photos of real people—the people you help, your volunteers, your staff—to bring your impact to life. An authentic smile connects in a way that a bar chart never will.
Picking the Right Format
The "best" format really comes down to who you're trying to reach and what you want them to do. Most nonprofits today use a mix of formats to cover all their bases.
- Printable PDF: This is the classic. A PDF feels professional, is easy to email, and can be printed for board meetings or sent to major donors. The downside? They aren't very interactive and can be a pain to read on a phone.
- Interactive Microsite: Think of this as a mini-website just for your annual report. You can embed videos, add animated charts, and link straight to your donation page. It's incredibly shareable on social media, but it does take more tech-savvy to build.
An annual report isn't a history book anymore. It's a living, breathing part of your outreach. The real goal is to create a central piece of content you can chop up and share across all your channels throughout the year.
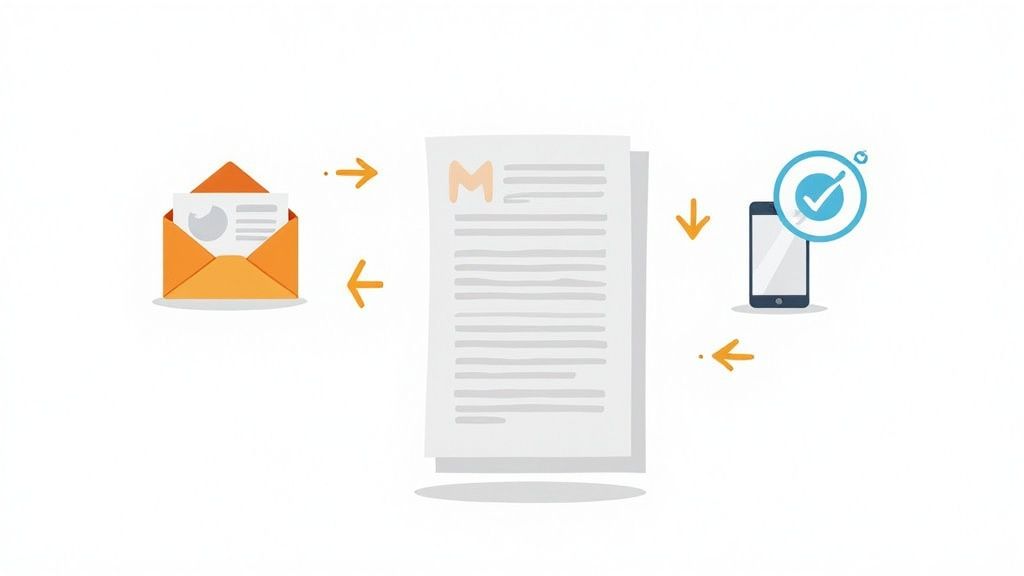
Spreading the Word: A Multi-Channel Plan
Once your report is designed and ready to go, it’s time to get it out there. A smart distribution plan ensures your hard work actually pays off.
- Email Your Community: Draft a special email for your entire list announcing the new report. Pull out one or two compelling stats or a short story to pique their interest, then add a clear link to download or view the full thing.
- Make it a Website Star: Don't bury it! Feature the report right on your homepage. It’s also a great idea to create a permanent, easy-to-find page for it, making it a go-to resource for grant funders and future donors.
- Share it on Social Media (The Right Way): Don't just post a link and call it a day. Break your report into bite-sized pieces for social media. Over the next few weeks, share individual infographics, powerful quotes, key numbers, and even short video clips to keep people engaged and drive them back to the full report.
How Your Report Can Win Over Corporate Partners
Think of your annual report as more than just a recap for your current donors. It's one of your most powerful, yet often overlooked, tools for catching the eye of institutional funders—think corporate sponsors and major grant-makers. These partners operate differently than individual givers. They're looking for a compelling business case, a partnership that fits neatly into their corporate social responsibility (CSR) goals and delivers a real return on their community investment.
A well-designed annual report forces you to gather and present the exact kind of data corporations want to see. They need to understand your reach, how efficiently you run your programs, and where their employees might be able to jump in and help. Suddenly, your report isn't just a summary; it's a professional, data-driven pitch you can leave behind after a meeting to make a lasting impression.
Speaking Their Language
When a company's community relations manager flips through your annual report, they aren't just reading a story; they're evaluating a potential partnership. They need to see information presented in a way that aligns with their own internal metrics for success. Broad, feel-good statements about "making a difference" simply won't resonate. You have to back it up with tangible results.
To really connect, make sure you zero in on these areas:
- Community Reach and Demographics: Be specific about how many people you serve and which communities you touch. Businesses are often looking for partners with a solid local or regional presence.
- Program Efficiency: Show them you’re a responsible steward of their potential investment. A simple, powerful metric like "90% of every dollar goes directly to program services" speaks volumes.
- Brand Alignment and Visibility: Give them a taste of what a partnership could look like. Including the logos of your current corporate sponsors or describing collaborative projects shows you know how to build these relationships.
This shift in focus turns your report from a simple look-back into a forward-looking proposal. It proves you understand what they need and are ready to be a professional, high-impact partner.
Your annual report should make a clear business case for support. It’s your opportunity to show potential corporate partners not just the good you do, but how a partnership with you is a smart, strategic decision for their brand and their employees.
Carve Out a Space Just for Them
A one-size-fits-all report can get lost in the shuffle. The best approach? Create a section specifically for corporate partners. This immediately signals that you're serious about building these kinds of relationships and have already thought about what a win-win collaboration looks like. Use this space to thank your current supporters and lay out a clear vision for future opportunities.
This is a smart move, especially now. Corporate giving recently jumped by 9.1% to an all-time high of $44.4 billion, and your annual report is the perfect vehicle to steer some of that support your way. Diving into other nonprofit stats can help you get a better handle on this trend.
Showcase Ways They Can Get Involved
Companies today are looking for more than just a photo op with a giant check. They want meaningful ways to engage their employees, and your annual report is the perfect place to lay out the welcome mat.
Make it easy for them to see how their team can contribute by including specific, actionable ideas:
- Employee Volunteer Days: Pitch a clear, single-day project a corporate team could accomplish.
- Skills-Based Volunteering: Got a need for marketing, IT, or financial expertise? Ask for it!
- Matching Gift Programs: Explicitly call out that you welcome matching gifts, which is a huge and often untapped channel for corporate philanthropy.
By presenting these turnkey opportunities, you make it incredibly easy for a corporate partner to say "yes." You're not just asking for a check; you're inviting them to become a genuine part of your mission. It’s a strategic approach that can unlock the kind of powerful, long-term partnerships that will fuel your work for years to come.
Streamlining Your Reporting with Modern Tools
Let's be honest: creating an annual report often feels like a monumental chore. It's a scramble to hunt down data from different departments, wrangle with messy spreadsheets, and piece everything together before the deadline. It doesn’t have to be this draining.
What if your fundraising totals, donor stats, and program financials could just... appear in your annual reports for nonprofits template? That's not a fantasy anymore. By connecting your different software systems—your donor management platform, your accounting software, your program trackers—you can say goodbye to the soul-crushing task of manual data entry. This also significantly slashes the risk of human error.
Automate Data to Focus on Storytelling
The real win here is getting your team's time back. When you aren't bogged down for weeks just compiling numbers, you can shift your focus to what really moves the needle: telling your story. Using tools like workflow automation can dramatically cut down on the manual labor needed to pull together the data and draft different sections of your report.
This changes your role from data-gatherer to storyteller. With the numbers handled, you're free to spend your time interviewing the people you've helped, writing powerful impact stories, and fine-tuning the message that will truly resonate with your supporters. It’s about working smarter, so your final report is not just accurate, but genuinely compelling.
The right platform can serve as a single source of truth for all your critical information. This is a lifesaver for organizations managing grants alongside individual donations. To get a better handle on this, check out our guide to nonprofit grant management software.
Ensuring Data Integrity with a Clear Audit Trail
One of the best parts of using a modern reporting system is the transparency it creates automatically. When all your data flows through one central platform, you naturally build a clear and verifiable audit trail. Every single figure, from a $50 donation to a $5,000 program expense, can be traced right back to its origin.
This dashboard from a platform like Fundsprout shows how key metrics can be visualized in real-time.
Having this kind of at-a-glance view of your financial health and programmatic impact makes pulling accurate numbers for your report ridiculously simple and trustworthy.
This centralized approach does more than just simplify compliance; it builds donor trust. When you can confidently show that your data is clean and auditable, you’re proving your commitment to transparency and fiscal responsibility. That's the bedrock of any strong nonprofit.
Answering Your Top Questions About Nonprofit Annual Reports
Putting together an annual report often sparks a lot of questions. It’s a big project, and you want to get it right. Whether this is your first time using an annual reports for nonprofits template or you’re a seasoned pro, let’s tackle some of the most common questions we hear from nonprofit leaders just like you.
Getting clear on these points from the start will make the whole process smoother and ensure your final report truly connects with your community.
How Long Should Our Annual Report Be?
While there's no strict rule, a good benchmark for a PDF or printed report is somewhere between 10 and 20 pages. That gives you enough room to tell a compelling story, break down your financials, and thank your supporters without it feeling like a textbook.
If you're creating a digital-first report, like a dedicated page on your website, don't worry about "pages." Instead, think about scannability. Your goal is to create clean, well-organized sections that let people jump straight to what interests them. The name of the game is being thorough but concise—always be respectful of your readers' time.
What's the Single Most Important Part of the Report?
Every piece of your report has a job to do, but if we had to pick the MVPs, two sections consistently rise to the top for connecting with donors.
- Your Impact Stories: This is the soul of your report. Nothing connects with a reader like a personal story or a case study showing the real, human results of your work. This is where you make an emotional connection.
- Your Financial Summary: This is the report's brain. A simple, transparent look at your revenue and expenses is what builds trust and proves you’re a responsible steward of every dollar you receive.
At the end of the day, your supporters want to see the human impact their gift made possible, and they need to feel confident their money was handled well. Nail these two sections, and you're golden.
Can We Actually Create a Good Report on a Shoestring Budget?
You absolutely can. A powerful annual report is all about the quality of your content and the clarity of your message—not how much you spent on printing or graphic design. Substance will always win out over a glossy finish.
Focus your limited budget where it counts the most. Invest your time in gathering great photos that show your mission in action and in writing stories that come straight from the heart. There are fantastic free and low-cost design tools out there like Canva that offer professional-looking templates, letting you create something beautiful without hiring a designer.
Should We Go with a Digital or a Printed Report?
For most nonprofits today, the best answer is: why not both? A hybrid approach really gives you the best of all worlds. A digital version—whether it’s a downloadable PDF or a cool interactive webpage—is affordable, easy to share across social media and email, and much better for the environment.
But don't discount the power of print entirely. Think about doing a small run of high-quality physical copies. You can reserve these for your major donors, board members, or key community partners. A printed report can feel like a special, tangible thank-you that makes your most important supporters feel truly seen and valued.
Ready to stop wrestling with spreadsheets and start telling your story? Fundsprout provides the tools you need to automatically populate your reports with accurate, audit-ready data, freeing you to focus on what matters most: your mission. Learn more at https://www.fundsprout.ai.
Try 14 days free
Get started with Fundsprout so you can focus on what really matters.