What Does YTD Mean for Your Nonprofit in 2026
What does YTD mean for nonprofits? Learn how to use Year-To-Date data to boost fundraising, manage finances, and write winning grant proposals with this guide.


Abdifatah Ali
Co-Founder
So, what exactly does YTD mean? You've probably seen this little acronym on financial reports or fundraising dashboards. Put simply, YTD stands for Year-To-Date. It’s a running total of something—like donations, expenses, or volunteer hours—from the very first day of the year up to right now.
Think of it as a snapshot showing you how things are going so far this year.
What Does YTD Mean in Simple Terms
![]()
Let's use an analogy. Imagine your annual fundraising goal is a marathon. Your YTD fundraising total is simply your mileage at any given point in the race. It’s not the final result, but a real-time progress report telling you how far you’ve come.
For any mission-driven nonprofit, this metric is more than just accounting jargon. It’s a vital pulse check on your organization’s health, giving you crucial insight without making you wait until the end of the year for a final report.
Why YTD Is a Practical Tool
At its core, YTD is a management tool that provides immediate clarity. Instead of guessing how your organization is performing, you can look at specific YTD data to get a clear, honest picture.
This allows you to:
- Track donation progress against your annual goals.
- Monitor program expenses to make sure you’re staying within budget.
- Analyze key performance indicators (KPIs) in real time.
By keeping a close eye on YTD metrics, you can shift from putting out fires to making proactive, strategic decisions. For example, if you notice by June that your YTD donations are lagging, you have a full six months to launch a new campaign, rally your supporters, and get back on track.
The real power of YTD is how it turns raw data into actionable intelligence. It answers the one question every nonprofit leader constantly asks: "Where do we stand right now?" Answering that question with confidence is what empowers you to steer your mission with agility and purpose.
Why YTD Is a Critical Metric for Nonprofit Success

Knowing the definition of YTD is one thing, but actually using it to guide your mission is where the magic happens. For smart nonprofits, year-to-date data is so much more than a box to check for accounting—it’s your real-time navigation system. Sharp executive directors and development teams lean on YTD metrics to make crucial course corrections all year long.
Think about it. Instead of getting a nasty surprise in December that you’ve missed your fundraising goals, tracking YTD donations lets you spot a downturn in May. That early warning gives you months to pivot your strategy, launch a new campaign, or reconnect with key donors. It’s the difference between reacting to a crisis and proactively leading your team to success.
Drive Smarter Decisions and Boost Confidence
When you get comfortable with YTD data, you start managing your resources with incredible precision. By tracking your YTD program expenses against what you budgeted, you can catch overspending before it spirals out of control. That kind of fiscal responsibility isn't just good for your bottom line; it builds immense confidence with your board and funders.
This data-driven approach also helps you frame your progress within the larger economic picture. For example, a mid-March 2026 outlook from J.P. Morgan showed that 71% of business leaders felt confident about their company's performance, with 73% expecting strong revenue growth. By tracking your own YTD fundraising, you can build a narrative that aligns with this kind of funder optimism. You can see more details in J.P. Morgan's 2026 business leaders outlook.
A year-to-date report is a story in progress. It tells you where you’ve been, where you are now, and—most importantly—gives you the insight needed to control where you’re going.
Strengthen Your Funding Appeals
This is where your YTD numbers become one of your most persuasive fundraising tools. When you’re writing a grant proposal, funders are looking for more than just a good idea; they want proof of momentum and a stable, well-run organization. Hard numbers always speak louder than hopeful promises.
Imagine the power of including statements like these in your next grant application:
- "As of June 30, our YTD fundraising has already secured 60% of our annual goal, demonstrating strong community trust and support for this initiative."
- "Our YTD program expenses are holding at 48% of the annual budget, underscoring our commitment to efficient stewardship of funds."
This kind of language immediately transforms your request from a simple appeal into a compelling investment opportunity. You’re showing funders that your nonprofit isn’t just planning to make a difference—you're already doing it. That makes you a much safer, and far more attractive, partner for their support.
How to Calculate and Interpret Your Key YTD Numbers
Don't let the term "year-to-date" intimidate you. The calculation itself is actually quite simple—you don't need a finance degree or complicated software to get started.
At its heart, you're just adding things up. The formula is simply: YTD Value = Sum of all transactions from the start of the year to the current date.
Let's say your nonprofit brought in donations of $5,000 in January, $7,000 in February, and $4,500 in March. As of March 31st, your YTD fundraising revenue would be $16,500. It's that easy. This gives you a live snapshot of your progress.
Turning Data Into Action
Of course, a number on its own doesn't tell you much. The real magic happens when you interpret what that number means for your organization. Is that $16,500 good? Are you on track, or is it a sign you need to make a change?
A handy rule of thumb is to compare your progress to the calendar. If you're six months into your fiscal year (say, on June 30th), you’d hope to be at or near 50% of your annual goal for both revenue and expenses.
Interpreting YTD data is about asking the right questions. Being at 40% of your goal in June isn't a failure—it's a critical signal to investigate why and adjust your strategy for the second half of the year.
YTD performance really comes to life inside your key financial reports. A solid understanding of the difference between P&L and Balance Sheet is crucial here, as it helps you connect the dots and see the full picture of your nonprofit's financial health.
Here’s how you can translate your YTD numbers into clear next steps:
- Ahead of Schedule: Your YTD revenue is at 60% by mid-year. Fantastic! This signals strong momentum. Maybe now is the perfect time to invest that surplus into a new pilot program or build up your cash reserves for a rainy day.
- Behind Schedule: Your YTD expenses are already at 65% by mid-year. This is an early warning flare. The good news is you have time to figure out what's driving the overage and make cuts before it spirals into a year-end crisis. Our guide to accounting for grants can also offer strategies for managing restricted funds more effectively.
YTD in Action: Real-World Nonprofit Scenarios
Knowing the definition of YTD is one thing. Seeing it in action is where it really clicks. Think of YTD data not as static numbers on a spreadsheet, but as the unfolding story of your year, giving you the power to make smart moves when it matters most.
Let’s put this into perspective with a common scenario. Imagine a small animal shelter. It’s June, and the finance committee is looking at the YTD reports. They notice individual donations are lagging well behind their mid-year goal. This isn't a reason to panic—it's a signal to act.
Armed with this specific insight, they quickly launch a targeted "Summer Support" campaign. They're transparent with their community about the YTD shortfall, and it works. By August, donations are right back on track. That’s the power of a timely YTD check-in.
Proving Impact and Securing Funding
YTD metrics are also one of your most powerful tools for grant writing. Let's say an after-school arts program is trying to renew a major grant. Instead of just describing their great work, they can show it.
They present the hard data in their proposal: YTD student attendance is 30% higher than it was at the same point last year. This single metric proves a growing demand for their services and makes their case tangible, compelling, and much harder for funders to ignore.
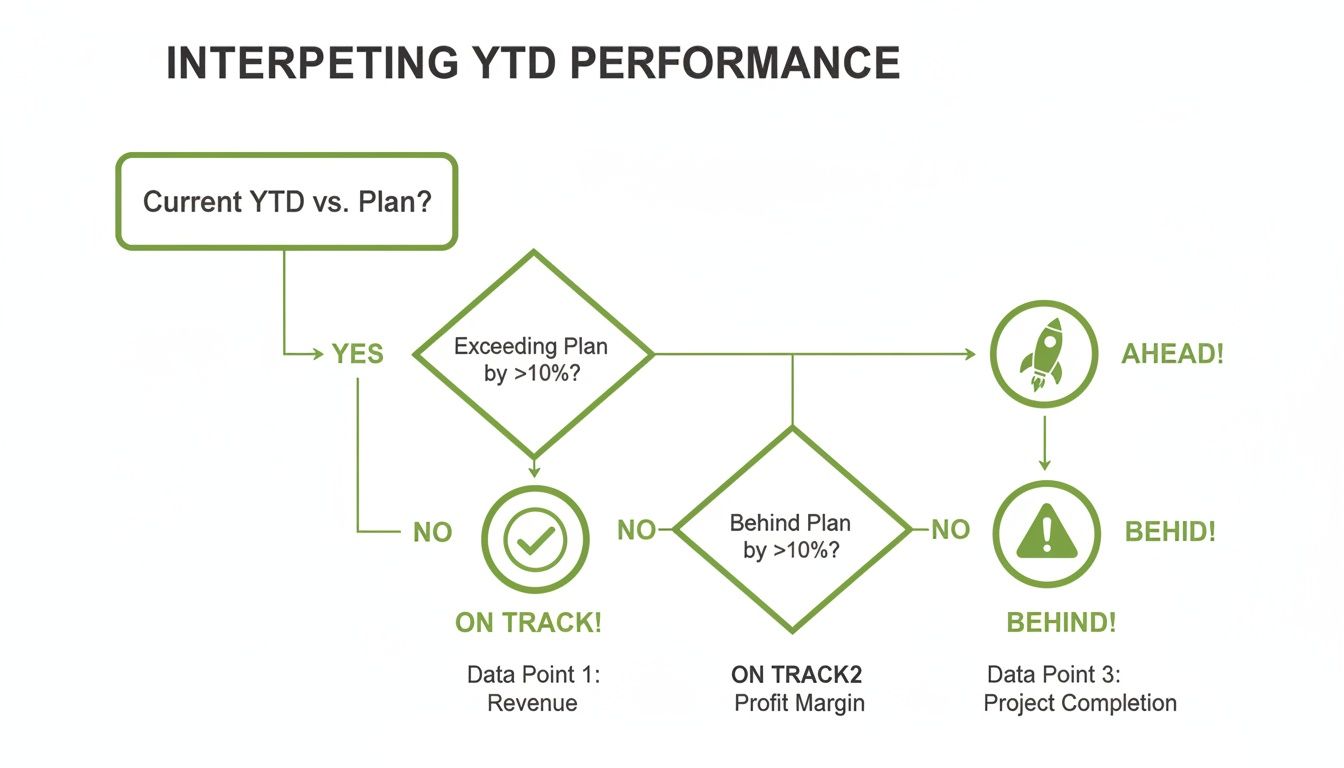
This flowchart gives you a simple framework for turning your YTD numbers into a clear plan of action.
Here's another way this plays out. A conservation group is applying for funding and uses its YTD volunteer hours—which have already topped 5,000 by the third quarter—to demonstrate impressive community buy-in and the capacity to manage the proposed project.
Strong YTD data helps you build a credible and realistic budget example for your nonprofit that inspires confidence in funders.
YTD analysis is like a compass for your mission. It doesn't just show you where you are; it points you toward your next right move, whether that's a new fundraising push or a strategic shift in program delivery.
For instance, if your YTD analysis reveals that donor engagement is slipping through your usual mailers and emails, it might be the perfect catalyst to explore new channels like mobile app development for nonprofits to connect with supporters.
This same logic applies to endowment management. Some early 2026 YTD stock market performers saw huge gains, like Corning Inc. at +74.14%, while others stumbled. A strong YTD gain might be the green light to fund a new initiative, whereas a sharp drop signals an urgent need to talk with your financial advisor and adjust your strategy. You can explore more about stock market performance to see how these trends develop.
Using YTD Data to Write Winning Grant Proposals
This is where knowing your YTD numbers can make all the difference in fundraising. A grant proposal backed by current, solid data doesn’t just ask for money—it presents a compelling case for investment. Funders are always looking for proof of momentum, community trust, and smart financial management. Your YTD figures can demonstrate all three.
When you weave these metrics into your proposal's story, you shift from making promises to showing proof. It's the difference between saying "we hope to achieve..." and "we are already achieving..."
Turning Data Into a Persuasive Story
The trick is to frame your YTD data with clear, confident language. You don't need to be a financial wizard; you just need to connect the numbers to your mission's success.
Here are a few practical ways to do it:
- To Showcase Momentum: "Our YTD fundraising has already reached 65% of our annual target, indicating robust community backing for this initiative."
- To Demonstrate Fiscal Discipline: "Through Q2, our YTD administrative expenses are at 48% of our annual budget, showcasing efficient stewardship of donor funds."
This kind of specific, up-to-date reporting shows funders that your organization is a responsible and effective partner—a safe bet. To make your financial case even stronger, you can build out your numbers using a professional grant budget with our template.
A grant proposal with strong YTD metrics says, "We are already succeeding, and your support will amplify that success." This proactive stance is far more persuasive than simply asking for help to get started.
This also applies to reporting on investments, like an endowment. For example, in early 2026, the average YTD gain for A-rated stocks was +4.15%. A nonprofit reporting a similar YTD gain could show funders that its investments are growing responsibly, generating more resources for the mission. You can discover more insights about 2026 YTD stock performance to see how broader market trends provide context for your own financial health.
Your Common YTD Questions Answered
Once you start using year-to-date figures in your reports and meetings, you'll find a few common questions pop up again and again. Getting the answers straight is the key to turning YTD from just another number into a genuinely useful tool for making smart decisions.
Let's walk through the questions we hear most often.
What Is the Difference Between YTD and a Fiscal Year?
This is probably the most important distinction to get right. Your fiscal year is the entire 12-month race your organization is running. YTD is simply your split time at any given point in that race.
Many nonprofits don’t follow the standard calendar year. It's common to have a fiscal year that runs from July 1 to June 30, for example. If that’s your setup, your YTD clock starts on July 1, not January 1.
Key Takeaway: Your YTD starting line is always the first day of your organization's specific fiscal year. It’s a running tally of your performance from that day forward.
How Often Should I Check My YTD Numbers?
There's no magic number here, but a good rule of thumb is to check your key YTD metrics at least monthly. This cadence is frequent enough to spot a potential issue before it snowballs, but not so often that you’re overreacting to every tiny dip and spike.
Of course, if you're in the middle of a major capital campaign or navigating a particularly tight budget, you might want to glance at the numbers weekly.
As crime data analysts often point out, YTD data gets more meaningful as the year goes on. A small dip in fundraising in January might not mean much, but that same percentage drop in September is a much stronger signal that something needs attention. The goal is to find a rhythm that helps you see real trends, not just daily noise.
Is It Useful to Compare My YTD Progress to Other Nonprofits?
It's natural to want to see how you measure up, but I'd urge caution here. Comparing your YTD numbers to another organization—even one in the same city—can be like comparing apples to oranges. A local theater's fundraising cycle is going to look completely different from a food bank's. Their missions, donor bases, and funding models are just too different for a direct comparison to be useful.
What’s far more powerful is benchmarking against yourself.
How does this year’s YTD fundraising total compare to where you were at this exact same time last year? Or the year before? Tracking your own progress over time gives you a much clearer, more relevant baseline for what success actually looks like for your organization.
Ready to turn your YTD insights into winning grant proposals? Fundsprout is an AI-powered platform that helps you find the right funding opportunities and craft compelling applications backed by your own performance data. Discover how our tools can help you tell a powerful story of impact at https://www.fundsprout.ai.
Try 14 days free
Get started with Fundsprout so you can focus on what really matters.